


Abstract
Mechanisms leading to cachexia in heart failure (HF) are not fully understood. We evaluated signs of intestinal congestion in patients with chronic HF and their relationship with cachexia.
Of the 165 prospectively enrolled outpatients with left ventricular ejection fraction ≤40%, 29 (18%) were cachectic. Among echocardiographic parameters, the combination of right ventricular dysfunction and elevated right atrial pressure (RAP) provided the best discrimination between cachectic and non-cachectic patients [area under the curve 0.892, 95% confidence interval (CI): 0.832–0.936]. Cachectic patients, compared with non-cachectic, had higher prevalence of postprandial fullness, appetite loss, and abdominal discomfort. Abdominal ultrasound showed a larger bowel wall thickness (BWT) in the entire colon and terminal ileum in cachectic than in non-cachectic patients. Bowel wall thickness correlated positively with gastrointestinal symptoms, high-sensitivity C-reactive protein, RAP, and truncal fat-free mass, the latter serving as a marker of the fluid content. Logistic regression analysis showed that BWT was associated with cachexia, even after adjusting for cardiac function, inflammation, and stages of HF (odds ratio 1.4, 95% CI: 1.0–1.8; P-value = 0.03). Among the cardiac parameters, only RAP remained significantly associated with cachexia after multivariable adjustment.
Cardiac cachexia was associated with intestinal congestion irrespective of HF stage and cardiac function. Gastrointestinal discomfort, appetite loss, and pro-inflammatory activation provide probable mechanisms, by which intestinal congestion may trigger cardiac cachexia. However, our results are preliminary and larger studies are needed to clarify the intrinsic nature of this relationship.
Introduction
Cachexia, an involuntary loss of body mass, affects ∼16% of patients with heart failure (HF) and is an independent predictor of worse overall prognosis.1 The pathophysiology of cardiac cachexia is multifactorial in nature. Several mechanisms such as hormonal disturbances,2 overexpression of the pro-inflammatory cytokines,2 and malabsorption3 and reduced food intake4 have been reported. As previously shown, cachexia in HF is associated with right ventricular (RV) dysfunction rather than left ventricular (LV) impairment.5,6 Adverse metabolic changes leading to cachexia may in part be attributed to venous congestion of the gastrointestinal system, which arises from RV failure (Figure 1). However, the exact link between RV dysfunction and cachexia remains unknown. The aim of this study was to evaluate signs of intestinal congestion and their relationship to cachexia in a cohort of ambulatory patients with systolic HF.
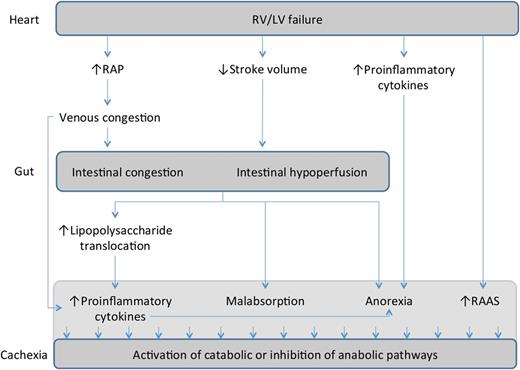
Possible mechanistic involvement of intestinal congestion in the pathophysiology of cardiac cachexia. Right ventricular failure and intestinal congestion may trigger malabsorption of nutrients, loss of appetite, and increased translocation of bacterial lipopolysaccharide. All these factors, along with long-term activation of renin–angiotensin–aldosterone system, may lead to cachexia.
Methods
Study design and patients
The present analysis is a part of the Studies Investigating Co-morbidities Aggravating HF (SICA-HF), a prospective, multicentre, observational study that was designed to evaluate the prevalence and impact of co-morbidities in patients with HF. The rationale, inclusion, and exclusion criteria were described in detail elsewhere.7 All patients had been diagnosed with HF at least 6 months before enrolment and were on optimal medical treatment. For this purpose, all 324 participants enrolled at the Charité Medical School Berlin between February 2010 and August 2013 were screened accordingly. Among the enrolled participants, 169 patients with moderate or severe LV systolic dysfunction [i.e. with an LV ejection fraction (LVEF) ≤40%] and valid follow-up data were considered for this analysis. Four patients were excluded due to consequent malignancy, severe chronic obstructive lung disease, or missing weight change history, and a total of 165 patients were further considered for our study. The local ethics committee approved the study, and patients were provided with written informed consents prior to enrolment.
Weight loss and cachexia
Weight was measured in light clothes without shoes at baseline and follow-up. Weight change history up to 24 months prior to enrolment was documented based on medical reports or patients' personal statements. Cachexia was defined according to the current consensus-based diagnostic criteria.8 Hence, the diagnosis was made in the presence of non-oedematous, non-intentional weight loss of ≥5% over a period of at least 6 months. In addition, at least three of the following criteria had to be fulfilled: (i) decreased muscle strength, defined using a handgrip strength test in the lowest tertile according to gender and age; (ii) fatigue; (iii) anorexia; (iv) lean tissue depletion, defined using the appendicular skeletal muscle index <5.45 kg/m2 for female and <7.26 kg/m2 for male patients,9 which was measured by the dual-energy X-ray absorptiometry (Lunar Prodigy, GE Healthcare, Chalfont St Giles, UK); and (v) abnormal biochemistry, defined by elevated inflammatory markers [high-sensitivity C-reactive protein (hsCRP) >5.0 mg/L] or anaemia (haemoglobin <12 g/dL). A total of 29 patients (18%) fulfilled the diagnostic criteria of cardiac cachexia.
Echocardiography
Two-dimensional transthoracic echocardiography was performed at baseline using the Vivid S6 system (Vivid S6, GE Medical Systems, Milwaukee, WI, USA). Detailed information on echocardiographic assessments is provided in Supplementary material online.
Measurements of bowel wall thickness
Diameter of the bowel wall was evaluated by transabdominal sonography in 78 patients (58 patients without cachexia, 20 patients with cachexia). All abdominal sonographies were performed by one expert gastroenterologist, who was blinded to all patients' characteristics, using 12-MHz linear-array transducer (HDI 5000, Philips Ultrasound, Belgium). Patients were scanned in the morning after fasting overnight. Bowel wall thickness (BWT) measurements were done in both longitudinal and transverse sections of the relaxed bowel wall and were recorded separately for five different intestinal segments: the terminal ileum (5 cm proximal to the ileocecal valve), the middle segment of the sigmoid, the descending colon, the transverse colon, and the ascending colon. The BWT was measured from the edge of the mucosa to the outer border of the muscularis propria (Figure 2) according to guidelines.10 Each measurement was repeated three times, and the mean was calculated for each intestinal segment. In addition, we calculated an average BWT (aBWT) as an arithmetic mean of all five bowel segments in every patient.
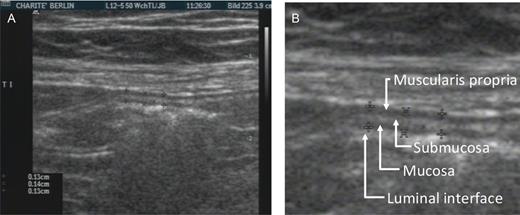
Measurement of bowel wall thickness by two-dimensional sonography. (A) Wall thickness measurement in the terminal ileum (longitudinal section). (B) Detailed cut-out showing four layers of different echogenicity.
Functional status, appetite, and gastrointestinal symptoms
Patients underwent cardiopulmonary exercise testing on a treadmill using standardized stepwise protocols described elsewhere.11 Appetite loss was assessed by a 6-point Likert scale, ranging from 0 (no) to 5 (very much). Gastrointestinal symptoms were assessed using the Gastrointestinal Symptom Rating Scale described in Supplementary material online.
Assembly of study cohorts
Baseline characteristics and weight change at follow-up were compared between 136 (82%) non-cachectic and 29 (18%) cachectic patients. Considering the imbalance in the baseline distribution of the New York Heart Association (NYHA) classes between the two groups, we conducted separate analyses in 48 (35%) non-cachectic patients with advanced stage of HF (NYHA class III or IV) and the cachectic patients. Finally, we assembled three subgroups of patients to evaluate associations between intestinal congestion and various degrees of RV failure: (i) patients with preserved RV function [i.e. with tricuspid annular plane excursion (TAPSE) ≥16 mm, n = 112]; (ii) patients with reduced RV function and normal right atrial pressure (TAPSE <16 mm and RAP <8 mmHg, n = 26); and (iii) patients with reduced RV function and elevated RAP (TAPSE <16 mm and RAP ≥8 mmHg, n = 24).
Statistical analysis
For descriptive analyses, we used the Mann–Whitney U test, Kruskal–Wallis test, and χ2 test, as appropriate. Correlations were evaluated by calculating Spearman's correlation coefficients. Simple logistic regression analysis was used to estimate associations between BWT and cachexia (the latter serving as the dependent variable). To assess potential confounding, we repeated the analysis using two different multivariable models: (i) adjusted for covariates that have been implicated in cardiac cachexia including LV function, RV function, and inflammation, and (ii) adjusted also for NYHA class. To evaluate the improvement in prediction of cachexia, when the model containing covariates indicative of intestinal congestion (BWT, TAPSE, and RAP) was used, we calculated the area under the curve (AUC) using the receiver-operating characteristic (ROC) curve analysis12 and compared it with a model (i) without covariates of intestinal congestion, as well as with three different models containing other covariates associated with advanced HF such as (ii) atrial fibrillation, (iii) haemoglobin, and (iv) peak oxygen consumption (peakVO2). Covariates of LV and RV function used in the multivariable models had been selected in advance among all baseline echocardiographic parameters using a stepwise logistic regression analysis. All statistical tests were performed using SPSS version 19.0.0 and Medcalc version 11.2.1. A two-tailed P-value of <0.05 was considered significant in all analyses.
Results
Patient characteristics
Baseline characteristics of the study population are displayed in Table 1. Cachectic patients were more likely to have advanced HF, worse LV and RV function, atrial fibrillation, and anaemia. When compared with non-cachectic patients with advanced HF, LV performance and distribution of NYHA classes were similar between cachectic and non-cachectic patients (Supplementary material online, Table S1). The body composition analysis showed a lower fat mass, without any differences in either the fat-free mass or the bone mineral content in cachectic patients, when compared with non-cachectic patients (Supplementary material online, Figure S1 and Supplementary material online, Table S1). The median length of follow-up was 6.6 months [interquartile range (IQR): 6.1–8.6 months]. During the follow-up, six patients died (four cachectic and two non-cachectic patients). At follow-up, the median weight change was −2.6% (IQR: −7.0 to 1.6) in the cachectic group, compared with 0.0% (IQR: −1.6 to 2.7) in the non-cachectic group (P-value = 0.05).
Baseline characteristics of study population
| Non-cachectic patients (n = 136) | Cachectic patients (n = 29) | P-value | |
|---|---|---|---|
| Clinical characteristics | |||
| Age (years) | 68.4 [60.9–74.5] | 70.3 [61.1–76.4] | 0.5 |
| Female (n, %) | 26 (19.1) | 4 (13.8) | 0.5 |
| Duration of HF (months) | 87.3 [36.9–192.4] | 98.9 [39.8–150.1] | 0.6 |
| NYHA class I/II/III/IV (n) | 13/75/48/0 | 0/2/25/2 | <0.001 |
| BMI (kg/m²) | 27.8 [25.5–32.3] | 23.7 [22.3–27.1] | <0.001 |
| PeakVO2 (mL/min/kg) | 17.1 ± 4.5 | 11.4 ± 2.8 | <0.001 |
| Ischaemic HF (n, %) | 93 (68.4) | 19 (65.5) | 0.8 |
| Hypertension (n, %) | 107 (78.7) | 20 (69.0) | 0.07 |
| Hyperlipidaemia (n, %) | 91 (66.9) | 19 (65.5) | 0.9 |
| Diabetes (n, %) | 56 (41.2) | 10 (34.5) | 0.5 |
| Smoking (n, %) | 16 (11.8) | 8 (27.6) | 0.04 |
| History of atrial fibrillation (n, %) | 50 (36.8) | 21 (72.4) | <0.001 |
| Moderate or severe leg oedema (n, %) | 23 (17.2) | 9 (31.0) | 0.09 |
| ACE inhibitor or ARB (n, %) | 126 (92.6) | 26 (89.7) | 0.7 |
| β-Blockers (n, %) | 131 (96.3) | 26 (89.7) | 0.07 |
| Aldosterone antagonists (n, %) | 73 (53.7) | 18 (62.1) | 0.7 |
| Loop diuretics (n, %) | 86 (63.2) | 24 (82.8) | 0.04 |
| Echocardiography parameters | |||
| LVEDD (mm) | 59.0 [53.3–64.8] | 62.5 [57.0–67.3] | 0.2 |
| Left atrium area (cm²) | 25.0 [23.0–30.0] | 29.0 [25.6–35.5] | 0.001 |
| LVEF (%) | 35.0 [30.0–40.0] | 30.0 [20.0–33.1] | <0.001 |
| E/E′ | 12.0 [9.4–16.8] | 19.6 [11.7–25.5] | 0.001 |
| PASP (mmHg) | 36.0 [31.0–47.0] | 51.0 [43.0–56.5] | <0.001 |
| TAPSE (mm) | 19.0 [16.0–22.0] | 14.5 [13.0–16.0] | <0.001 |
| Moderate or severe TR (%) | 18 (13.2) | 14 (50.0) | <0.001 |
| RVSP estimate (mmHg) | 29.0 [24.0–36.0] | 38.0 [33.0–44.0] | <0.001 |
| IVC diameter (mm) | 18.0 ± 3.9 | 22.1 ± 4.7 | <0.001 |
| Laboratory parameters | |||
| hsCRP (mg/dL) | 2.4 [1.1–4.2] | 6.6 [2.1–7.0] | <0.001 |
| GFR (mL/min) | 63.4 [50.6–71.0] | 52.2 [41.8–68.9] | 0.05 |
| Haemoglobin (g/dL) | 13.5 ± 1.4 | 12.4 ± 2.1 | 0.01 |
Continuous variables are expressed as mean ± standard deviation if they are normally distributed or as median (interquartile range 25–75%) if they are not normally distributed. Categorical variables are expressed as counts and percentages of the corresponding population.
BMI, body mass index; ACE, angiotensin-converting enzyme; ARB, angiotensin receptor blockers; LVEDD, left ventricular end-diastolic diameter; PASP, pulmonary artery systolic pressure; TR, tricuspid regurgitation; RVSP, right ventricular systolic pressure; IVC, inferior vena cava; GFR, glomerular filtration rate (using the Modification of Diet in Renal Disease Study equation).
Right ventricular function and right atrial pressure
Cachectic patients, when compared with non-cachectic ones, were more likely to have a reduced systolic RV function (72 vs. 24%) and increased RAP (78 vs. 14%; both P-values < 0.001). Similar results were found in cachectic vs. non-cachectic patients with advanced HF (Supplementary material online, Table S1). The ROC curve analysis showed that TAPSE and RAP provided a good discrimination between patients with and without cachexia (Table 2, pairwise P-value = 1.0). The discrimination has significantly improved by combining TAPSE with RAP [AUC 0.892, 95% confidence interval (CI): 0.832–0.936] compared with TAPSE alone (pairwise P-value = 0.02). Left ventricular ejection fraction was inferior in discriminating between the two groups of patients compared with the combination of TAPSE and RAP (Table 2, pairwise P-value = 0.002), TAPSE alone (pairwise P-value = 0.03), or RAP alone (pairwise P-value = 0.06). Regarding body composition, the absolute fat mass was found to correlate with RAP (r = −0.239) and TAPSE (r = 0.177; both P-values ≤ 0.04). In contrast to RV function, LV function did not correlate with body composition (all P-values ≥ 0.4).
Area under the receiver-operating characteristic curve and 95% confidence interval for echocardiographic parameters and atrial fibrillation for the prediction of cardiac cachexia
| AUC | 95% CI | Cut-off | Sensitivity (%) | Specificity (%) | |
|---|---|---|---|---|---|
| LVEDD | 0.588 | 0.509–0.665 | >61 mm | 63 | 56 |
| LA area | 0.712 | 0.635–0.781 | >27 cm2 | 70 | 65 |
| LVEF | 0.707 | 0.631–0.775 | <33% | 79 | 50 |
| E/E′ | 0.700 | 0.623–0.770 | >18.3 | 57 | 83 |
| PASP | 0.818 | 0.730–0.886 | >47 mmHg | 71 | 84 |
| TAPSE | 0.825 | 0.758–0.880 | ≤17 mm | 96 | 63 |
| RAP | 0.833 | 0.765–0.888 | ≥8 mmHg | 78 | 86 |
| Moderate or severe TR | 0.684 | 0.607–0.754 | – | 50 | 87 |
| Atrial fibrillation | 0.678 | 0.601–0.749 | – | 72 | 63 |
The baseline characteristics of the three groups of patients with different degrees of RV dysfunction are shown in Supplementary material online, Table S2. Cachexia was more frequently detected in patients with reduced RV function and elevated RAP than in patients with either reduced RV function but normal RAP or preserved RV function (67 vs. 15 vs. 7%; both P-values < 0.001). The latter two groups were also less likely to lose weight during the follow-up (Supplementary material online, Figure S2). Among the 112 patients with preserved RV function, 16 (13%) patients had elevated RAP and were more likely to have cachexia compared with those with normal RAP (31 vs. 2%, P-value < 0.0001) but less likely compared with the subgroup of patients with reduced RV function and elevated RAP (31 vs. 67%, P-value = 0.03).
Bowel wall thickness in patients with and without cachexia
The mean aBWT was 1.8 ± 0.2 mm in cachectic patients compared with 1.3 ± 0.04 mm in non-cachectic patients (P-value < 0.001), with larger BWT in all bowel segments in the cachectic group (Table 3). Similar results were observed when comparing cachectic with non-cachectic patients with advanced HF only (Figure 3). There was a positive correlation between the percentage of the previous weight change and aBWT (r = −0.279; P-value = 0.02).
Bowel wall thickness in non-cachectic vs. cachectic patients
| Non-cachectic patients (n = 58) | Cachectic patients (n = 20) | P-value | |
|---|---|---|---|
| Terminal ileum (mm) | 1.1 [0.9–1.2] | 1.3 [0.9–1.3] | 0.03 |
| Ascending colon (mm) | 1.2 [1.0–1.4] | 1.5 [1.3–1.8] | 0.001 |
| Transverse colon (mm) | 1.3 [1.1–1.5] | 1.4 [1.2–1.7] | 0.049 |
| Descending colon (mm) | 1.2 [1.1–1.6] | 1.9 [1.4–2.2] | <0.001 |
| Sigmoid (mm) | 1.4 [1.3–1.7] | 1.9 [1.5–2.5] | 0.002 |
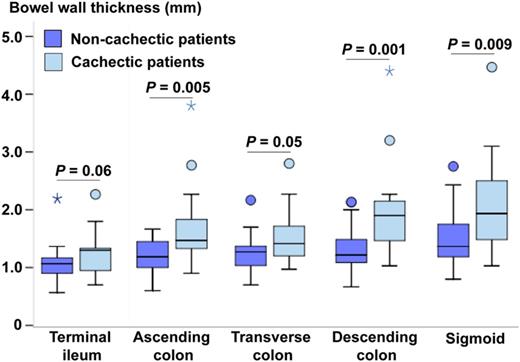
Bowel wall thickness in the subgroup of patients in advanced stage of heart failure.
Bowel wall thickness and cardiac function
Patients with RV dysfunction and elevated RAP presented with larger mean aBWT (1.7 ± 0.7 mm) than patients with either reduced RV function but normal RAP (1.3 ± 0.1 mm) or preserved RV function (1.3 ± 0.1 mm; both P-values ≤ 0.03; Supplementary material online, Figure S3). No correlation was found between aBWT and LVEF.
Bowel wall thickness, signs of fluid overload, and inflammation
A regional composition analysis of the body trunk showed a higher median truncal fat-free mass in cachectic patients compared with non-cachectic ones [14.6 kg/m2 (IQR: 13.4–15.7) vs. 13.6 kg/m2 (IQR: 12.7–14.5); P-value = 0.009], reflective of higher water content of the trunk. Truncal fat-free mass correlated with aBWT (Table 4) and RAP (r = 0.212; P-value = 0.01). High-sensitivity C-reactive protein correlated with BWT of the transverse colon (r = 0.239; P-value = 0.04), the sigmoid (r = 0.226; P-value = 0.048), and in trend with aBWT (Table 4).
Correlations between mean bowel wall thickness and parameters indicative of fluid overload, inflammation, and gastrointestinal symptoms
| Correlation coefficient | P-value | |
|---|---|---|
| Truncal fat-free mass | 0.361 | 0.002 |
| Peripheral oedema | 0.379 | <0.001 |
| hsCRP | 0.212 | 0.06 |
| Abdominal discomfort | 0.414 | <0.001 |
| Appetite loss | 0.304 | 0.009 |
| Postprandial fullness | 0.274 | 0.02 |
| Correlation coefficient | P-value | |
|---|---|---|
| Truncal fat-free mass | 0.361 | 0.002 |
| Peripheral oedema | 0.379 | <0.001 |
| hsCRP | 0.212 | 0.06 |
| Abdominal discomfort | 0.414 | <0.001 |
| Appetite loss | 0.304 | 0.009 |
| Postprandial fullness | 0.274 | 0.02 |
Bowel wall thickness, gastrointestinal symptoms, and loss of appetite
When comparing cachectic with non-cachectic patients, the former suffered more often from postprandial fullness (69 vs. 44%), loss of appetite (67 vs. 29%), nausea or vomiting (48 vs. 24%), burping (48 vs. 19%), and abdominal discomfort (38 vs. 17%; all P-values ≤ 0.02). Overall, they had a higher gastrointestinal symptom burden with a median of six concurrent symptoms (IQR: 3–9) compared with four symptoms (IQR: 1–6) in non-cachectic patients (P-value = 0.02). The presence and severity of gastrointestinal symptoms correlated with aBWT (Table 4).
Associations between bowel wall thickness and cachexia
Cachexia was associated with larger BWT of all bowel segments (Table 5) and aBWT [odds ratio (OR) 1.3; 95% CI: 1.1–1.6; P-value = 0.002]. The association between aBWT and cachexia remained significant even after adjustment for cardiac function, inflammation, and NYHA class (Table 5). Among the cardiac parameters, only RAP remained significantly associated with cachexia in the aforementioned model adjusted for cardiac function and inflammation (OR per 1 mmHg increase: 1.3; 95% CI: 1.0–1.5; P-value = 0.02), with a slight attenuation of the association once NYHA class was included in the model (OR 1.2; 95% CI: 0.99–1.5; P-value = 0.06). Analysis of improvement in discrimination between cachectic and non-cachectic patients showed that the model containing covariates indicative of intestinal congestion performed better than when these covariates were removed from the model (Figure 4). Moreover, this model also performed better than models containing other covariates associated with advanced HF such as atrial fibrillation, haemoglobin, and peakVO2 (Figure 4).
Unadjusted and adjusted odds ratios for cachexia by bowel wall thickness (per 0.1 mm increase)
| Unadjusted | Adjusteda | Adjustedb | ||||
|---|---|---|---|---|---|---|
| OR (95% CI) | P-value | OR (95% CI) | P-value | OR (95% CI) | P-value | |
| aBWT | 1.3 (1.1–1.6) | 0.002 | 1.4 (1.0–1.8) | 0.03 | 1.4 (1.0–1.8) | 0.03 |
| Terminal ileum | 1.2 (1.0–1.5) | 0.03 | 1.2 (0.9–1.6) | 0.2 | 1.2 (0.9–1.6) | 0.3 |
| Ascending colon | 1.4 (1.1–1.7) | 0.001 | 1.4 (1.0–2.0) | 0.03 | 1.4 (1.0–2.0) | 0.03 |
| Transverse colon | 1.2 (1.0–1.4) | 0.02 | 1.3 (0.96–1.7) | 0.09 | 1.3 (0.96–1.7) | 0.095 |
| Descending colon | 1.3 (1.1–1.5) | 0.001 | 1.3 (1.1–1.7) | 0.01 | 1.4 (1.1–1.7) | 0.01 |
| Sigmoid | 1.2 (1.1–1.3) | 0.003 | 1.2 (1.0–1.4) | 0.06 | 1.2 (1.0–1.4) | 0.06 |
aAdjusted for LA area, LVEF, TAPSE, RAP, and hsCRP.
bAdjusted for NYHA class, LA area, LVEF, TAPSE, RAP, and hsCRP.
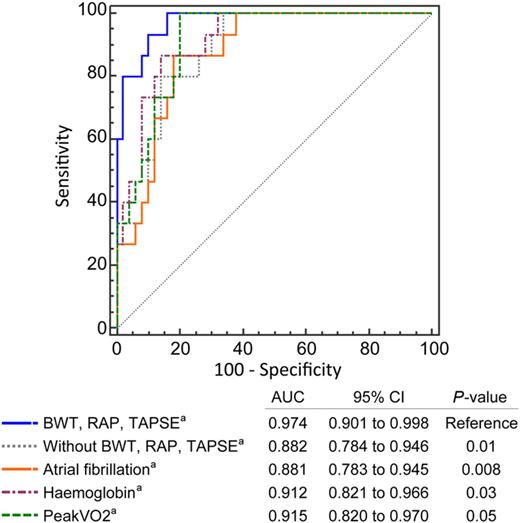
Comparison of receiver-operating characteristic curves and 95% confidence interval for discrimination of cachexia by using logistic regression model including covariates of intestinal congestion as a reference model. aOther covariates included in the model: New York Heart Association class, left ventricular ejection fraction, left atrial area, and high-sensitivity C-reactive protein.
Discussion
Our findings demonstrate that cardiac cachexia is associated with intestinal congestion in stable systolic HF patients, even after adjusting for other covariates involved in wasting. This corresponded with elevated RAP due to systolic RV dysfunction, both found in the majority of cachectic patients, indicating a haemodynamic link between congestive RV dysfunction and intestinal oedema. Larger BWT correlated with abdominal discomfort, appetite loss, postprandial fullness, and inflammation, which were also found to be highly prevalent in cachectic patients, and might mechanistically explain the association between intestinal congestion and cachexia. These findings are important, as the results from treatment trials in patients with cardiac cachexia have been discouraging so far,13 thus questioning our understanding of this complex co-morbidity.
Congestive right ventricular dysfunction as a marker of cardiac cachexia
In the current study, cachexia was stronger linked to elevated RAP than isolated RV dysfunction, suggesting an interaction between venous congestion and wasting. Of note, not all patients with RV dysfunction had a concomitant increase in RAP. These patients were considerably less likely to be cachectic or to lose weight during the follow-up compared with those with elevated RAP. On the other hand, a subset of patients with a formally normal RV function had elevated RAP and was more likely to have cachexia. Thus, it appears that elevated RAP is a more reliable parameter for stratifying patients with advanced HF regarding the risk for cachexia than systolic RV function, not to mention LV function alone. However, patients with reduced RV function and elevated RAP had the highest prevalence of cachexia, highlighting the haemodynamic dependence between RV and RA pressures. This pressure overload is further transmitted to the venous system resulting in splanchnic congestion and, in some cases, consecutive intestinal oedema. This explains our finding of larger BWT in patients with elevated RAP but the absence of the former in patients with normal RAP.
Intestinal congestion: possible mechanisms of action in cardiac cachexia
Splanchnic congestion was a typical finding in cachectic patients as shown by larger BWT and higher truncal water content compared with non-cachectic patients. Larger BWT was associated with appetite loss, postprandial fullness, and inflammation. These abnormalities, along with malabsorption, which may also result from venous congestion of the bowel wall, have pro-catabolic effects and offer a mechanistically plausible explanation for the observed association between intestinal congestion and cachexia (Figure 1).
In our study, more than two-thirds of cachectic patients suffered from appetite loss and postprandial fullness. These two factors were related to intestinal congestion and can further worsen reduced food intake that was shown in general HF population14 accelerating cachexia. A second mechanism, by which intestinal congestion may contribute to the development of cardiac cachexia, is via lipopolysaccharide-induced production of pro-inflammatory cytokines.15 The translocation of lipopolysaccharide into the systemic circulation seems to be abetted during oedematous decompensation,16 possibly as a consequence of acute intestinal congestion. Extending this finding, we suggest that chronic intestinal congestion, such as the one found in cardiac cachexia, may cause a persistent lipopolysaccharide translocation even in stable patients. Our finding of higher serum levels of hsCRP in cachectic patients, which correlated with larger BWT, supports this view. Similar mechanisms are supposed to play a role in gastroenterological diseases such as decompensated liver cirrhosis with spontaneous bacterial peritonitis.17 In addition to lipopolysaccharide-induced systemic release of pro-inflammatory cytokines, venous endothelial cells release cytokines locally in response to peripheral venous congestion.18 Both mechanisms may extend the understanding of the well-known relationship between congestive RV dysfunction and inflammation.19
It is also possible that intestinal congestion promotes wasting by malabsorption. Several studies have shown a various degree of malabsorption of carbohydrates, fat, and proteins in HF, with cachectic patients displaying the highest losses of nutrients through defaecation.3,20,21 However, whether malabsorption is triggered by intestinal congestion alone, or rather by other possible mechanisms, needs to be further studied.
Finally, the bivariate associations between intestinal congestion and cachexia may also be due to more advanced HF in cachectic patients. However, BWT was larger in cachectic patients, even when compared exclusively with non-cachectic patients with advanced HF. Moreover, associations between intestinal congestion and cachexia remained significant after adjustment not only for the NYHA class but also for other factors known to be involved in cardiac cachexia including RV, LV function, and inflammation. Also, logistic regression model containing covariates indicative of intestinal congestion discriminated better between patients with and without cachexia compared with models containing another signs of advanced HF such as anaemia, atrial fibrillation, and low exercise capacity. This suggests that associations between intestinal congestion and cachexia cannot be completely disparaged by more advanced HF.
Clinical implications: role of right-sided pressures
A better understanding of the role of chronically increased right-sided pressures and splanchnic congestion for poor prognosis in patients with HF is needed to clarify the question whether targeting right-sided haemodynamics could prevent wasting and improve the outcome in patients with HF. Currently, only limited data exist on the treatment of congestive RV failure.22 Clinicians might consider close monitoring of RAP by feasible methods such as evaluation of the jugular venous pressure and adjusting diuretic regimens in the presence of venous congestion. Whether this strategy can avoid involuntary weight loss is, however, currently unknown.
Limitations
The findings related to BWT were based on a small subset of patients, who were examined by abdominal ultrasound, thus increasing their probability to be observed by chance. However, significant differences in BWT between cachectic and non-cachectic patients were observed in the majority of measured bowel segments, hence making this observation less likely chance dependent. Of course, adjustment for other covariates cannot completely rule out residual confounding or confounding by a hidden covariate. However, larger BWT remained significantly associated with cachexia even after adjustment for cardiac function, inflammation, and NYHA class, indicating a strong relationship between intestinal congestion and cachexia.
Another limitation is the fact that the history of weight change prior to enrolment was based, in a subgroup of patients, on their statements due to the absence of measured values in medical reports, which could potentially be a source of inaccuracy. Missing information in medical reports cannot be completely avoided in real clinical practice. Self-reported anthropometric data were shown to be suitable for use in clinical studies since differences were considered small compared with measured values.23 However, studies investigating cachexia may require a higher accuracy of information on body weight history compared with other studies, and this can be warranted best by prospective weight measurements.
Conclusions
We showed that cardiac cachexia is associated with intestinal congestion and elevated RAP. Intestinal congestion along with accompanying gastrointestinal discomfort, appetite loss, and pro-inflammatory activation could provide mechanisms, by which congestive RV dysfunction triggers catabolism in advanced HF. However, due to observational design of the study, our findings remain hypothesis generating and need to be further confirmed in larger clinical studies that allow adjustment for natural differences in clinical characteristics between cachectic and non-cachectic patients.
Supplementary material
Supplementary material is available at European Heart Journal online.
Authors’ contributions
M.V. and A.S. performed statistical analysis. S.H., W.D., S.D.A., and A.S. handled funding and supervision. M.V., J.B., N.E., T.B., S.E., V.S., N.S., and A.S. acquired the data. M.V., S.H., J.B., W.D., S.D.A., and A.S. conceived and designed the research. M.V., A.S. and S.H. drafted the manuscript. S.H., J.B., W.D., N.E., T.B., S.E., N.S., J.M., S.D.A., and A.S. made critical revision of the manuscript for key intellectual content.
Funding
Part of this work was funded by the European Commission under the Seventh Framework Programme 439 (FP7/2007–2013) under grant agreement number 241558 (SICA-HF).
Conflict of interest: none declared.
References

