


Abstract
Late acquired incomplete stent apposition (ISA) is more common after drug-eluting stent (DES) than bare metal stent (BMS) implantation and has been associated with vascular hypersensitivity and stent thrombosis (ST). We investigated the impact of incidentally discovered ISA as assessed by intravascular ultrasound (IVUS) 8 months after DES implantation on the long-term clinical outcome.
A total of 194 patients with 221 lesions were prospectively followed through 5 years. At 8 months, IVUS showed evidence of ISA among 37 patients with 39 lesions (18%) (mean ISAmax 4.7 ± 5.0 mm2), whereas no ISA was observed among 157 patients with 182 lesions. Incomplete stent apposition was more prevalent among segments treated with sirolimus-eluting (n = 103) than paclitaxel-eluting stents (n = 118) (27 vs. 9%, P = 0.001). Between IVUS investigation at the 8-month and 5-year follow-up, major adverse cardiac events occurred more frequently in patients with (18.9%, n = 7) than without ISA (7.0%, n = 11) (HR = 2.71, 95% CI: 1.05–6.96, P = 0.031). While there were no differences with respect to death, the rate of myocardial infarction was higher among patients with (13.5%, n = 5) than without ISA (1.9%, n = 3) (HR = 7.53, 95% CI: 1.79–31.6, P = 0.001). Very late ST was more common among patients with than without ISA [Academic Research Consortium-definite ST:13.5% (n = 5) vs. 0.6% (n = 1) HR = 23.2, 95% CI: 2.65–203, P < 0.001].
In the present study, the presence of ISA as assessed by IVUS 8 months after DES implantation was associated with a higher rate of myocardial infarction and very late stent thrombosis during long-term follow-up. The prognostic impact of ISA on long-term clinical outcomes requires further investigation.
Introduction
Incomplete stent apposition (ISA) is a morphological feature assessed by intravascular imaging, such as intravascular ultrasound (IVUS), or optical coherence tomography and describes the lack of contact between stent struts and the adjacent arterial wall. The timing of intravascular imaging relative to the index procedure allows to distinguish between post-procedural, persistent, and late acquired phenotypes. Incomplete stent apposition assessed by IVUS has been reported in up to one-third of treated segments after drug-eluting stents (DES) implantation,1 and has been related to various causes such as inhomogeneous stent expansion at the time of stent implantation, dissolution of thrombus behind stent struts in the setting of acute myocardial infarction (MI), chronic stent recoil, or positive arterial remodelling with an increase in the external elastic membrane (EEM) out of proportion to the increase in peri-stent plaque and media.2,3 The latter phenomenon may be of particular importance in patients treated with DES.
An exceedingly high incidence of ISA (>75%) has been observed among patients presenting with very late stent thrombosis (ST).3–5 In addition, the extent of positive vessel remodelling associated with ISA among patients suffering from very late ST has been correlated with the amount of inflammatory infiltrates at the vicinity of stent struts, suggesting an underlying vascular toxicity in the pathogenesis of very late ST. Conversely, the clinical impact of incidentally discovered ISA in otherwise asymptomatic patients is debated. Late acquired ISA has been reported in 2–5% of segments after bare metal stent (BMS)6,7 and in 7–21% after DES implantation,8,9 and several studies failed to observe untoward adverse events related to ISA.8–14 However, these studies were limited by small patient populations and a short follow-up duration, prohibiting firm conclusions. The aim of the present study was therefore to investigate the long-term clinical outcome up to 5 years among patients with compared with those without ISA as assessed by IVUS 8 months after DES implantation.
Methods
Patient population
Patients of the present study constitute a subpopulation of the SIRTAX trial.15 In this prospective, single blind, randomized trial, 1012 patients were treated with either sirolimus-eluting (SES) (Cypher and Cypher Select, Cordis, Miami Lakes, Florida) (503 patients), or paclitaxel-eluting stents (PES) (Taxus Express 2, Boston Scientific Corp., Natick, Massachusetts) (509 patients). Of the overall SIRTAX trial population, 540 patients underwent repeat angiography at 8 months. The first 234 patients (323 segments) of the angiographic follow-up cohort also underwent IVUS investigation (Figure 1). After exclusion of 38 patients (50 segments) from the IVUS image analysis due to failed acquisition, inadequate pullback, or poor image quality, IVUS analysis at 8 months was possible in 196 patients (223 segments). For the purpose of the current analysis, two patients who suffered from ST between the time of stent implantation and IVUS investigation at 8-month follow-up were excluded from the analysis. The remaining 194 patients (free of MI at 8 months) with 221 DES segments constitute the patient population with a landmark analysis of clinical outcome between 8 months after DES implantation (time point of IVUS investigation) and 5 years of follow-up. We compared the baseline characteristics and clinical outcome between patients with and without IVUS investigation at 8 months, and between patients with and without ISA. Of note, IVUS imaging was not performed at baseline but only at the time of angiographic follow-up precluding the differentiation between persistent and late acquired ISA. The institutional review board of both participating institutions approved the study. All patients provided written informed consent. The study complied with the declaration of Helsinki regarding investigations in humans and was approved by the Ethics Committees at the Bern University Hospital and University Hospital Zurich, both in Switzerland.
Flow chart of study population. ISA, incomplete stent apposition; IVUS, intravascular ultrasound.
Quantitative coronary angiographic analysis
Coronary angiograms were digitally recorded at baseline, immediately after the procedure, and at follow-up and analysed by personnel unaware of the type of the implanted stent. Digital angiograms were analysed with the use of an automated edge-detection system (CAAS II, Pie Medical Imaging). Quantitative measurements included the diameter of the reference vessel, the minimal luminal diameter, and per cent diameter stenosis (defined as the diameter of the reference vessel minus the minimal luminal diameter, divided by the reference diameter and multiplied by 100).
Intravascular ultrasound image acquisition and analysis
The protocol sequence to obtain IVUS imaging at the 8-month follow-up has been previously described in detail.3 Briefly, the IVUS catheter (Eagle Eye® scanner, Volcano Therapeutics, Inc.) was positioned >10 mm beyond the distal edge of the study stent and was withdrawn using a motorized pullback (0.5 mm/s). Quantitative IVUS analyses were performed off-line according to the criteria of the clinical expert consensus document on IVUS using computerized planimetry (In-Vision View® 1.0, Medimatic, Inc.).16 Quantitative measures included the EEM, lumen, and stent cross-sectional area (CSA) at stented and reference segments. The image slice with the smallest stent and lumen CSA, and the image slice with the greatest EEM were also analysed. The proximal and distal reference segments selected for the analysis were the most normal-appearing cross-sections within 10 mm proximal or distal to the lesion but before any side branch. Incomplete stent apposition was defined as lack of contact between at least one strut and the underlying arterial wall intima that did not overlap a side branch with evidence of blood flow behind the strut. The length of the ISA site was measured from multiple longitudinal views. When the patient had ISA sites separated from each other by areas of completely apposed stented segments, the total length of the ISA was defined as the sum of the lengths of each ISA segment. In the segment with ISA, the lumen contours were delineated within and outside the stent strut boundaries.17 Within the ISA segment, stent and lumen CSA were measured every 0.5 mm.
Study endpoints and definitions
All patients were prospectively followed per protocol at 1, 6, and 9 months, and 1, 2, 3, 4, and 5 years after stent implantation. An independent clinical events committee blinded to treatment assignment and IVUS findings adjudicated all endpoints. Major adverse cardiac events (MACEs) were defined as the composite of cardiac death, MI, or clinically driven target lesion revascularization (TLR). Target lesion revascularization and target vessel revascularization (TVR) were considered to be clinically driven if the stenosis of the target lesion or vessel was >50% on the basis of quantitative coronary angiography in the presence of ischaemic signs or symptoms, or if there was a stenosis of >70% in the absence of ischaemic signs or symptoms. Target lesion revascularization was defined as a repeated revascularization based on a stenosis within the stent or within the 5-mm borders proximal or distal to the stent. The diagnosis of MI after the intervention was established whenever new Q-waves of at least 0.4 s duration in at least two contiguous leads appeared on the electrocardiogram with an elevated creatine kinase MB fraction level, or in the absence of pathological Q-waves, an elevation in creatine kinase levels to more than twice the upper limit of normal with an elevated creatine kinase MB or troponin I level. Definite ST fulfilled the Academic Research Consortium (ARC)18 criteria and was defined as an acute coronary syndrome with angiographic documentation of either target vessel occlusion or thrombus within or adjacent to the previously successfully stented segment.
Statistical analysis
Normally distributed variables were analysed using parametric tests and non-normally distributed data using non-parametric tests. Continuous variables are expressed as mean ± standard deviation and differences were compared using Student's t test or Mann–Whitney U test. Categorical variables are expressed as counts and percentages and differences were assessed by the Fisher exact test or χ2 test, as appropriate. The comparison between the groups were carried out using a mixed model and P-values are derived using maximum likelihood logistic and linear-regression models based on robust standard errors that allow for the correlation of multiple lesions within patients. Event-free survival was analysed with the Kaplan–Meier method, and the corresponding probability value was obtained from a log-rank test. The Mantel–Cox method was used to estimate hazard ratios and 95% confidence intervals for comparisons of clinical outcomes between groups and the log-rank test to calculate corresponding P-values. No adjustments were made for multiple comparisons in secondary analyses; P-values are two-sided; the significance level was set at 0.05. Analyses were performed in STATA (Stata, Inc., College Station, TX, USA).
Results
Baseline clinical, angiographic, and procedural characteristics
Baseline clinical and angiographic characteristics of patients undergoing IVUS at 8 months and those not undergoing IVUS are summarized in Table 1. Compared with patients not undergoing IVUS, those undergoing IVUS were younger (59.5 ± 10.4 vs. 62.9 ± 11.2 years, P = 0.001), more frequently male (82.0 vs. 75.5%, P = 0.055), less frequently hypertensive (54.1 vs. 63.4%, P = 0.018), and had better left ventricular function (58.3 ± 10.3 vs. 56.3 ± 12.1%, P = 0.029). A total of 194 patients with 221 segments treated with 103 SES and 118 PES underwent IVUS 8 months after DES implantation. Among patients undergoing IVUS, baseline angiographic variables were well balanced between SES and PES. Lesion length amounted to 12.9 ± 6.8 and 14.2 ± 8.4 mm in SES- and PES-treated segments, respectively (P = 0.24), and reference vessel diameter was 2.81 ± 0.43 and 2.83 ± 0.44 mm, respectively (P = 0.25). Stent length (SES: 18.5 ± 8.5 mm vs. PES: 19.1 ± 10.1 mm, P = 0.64) and stent diameter (SES: 2.93 ± 0.32 mm vs. PES: 2.97 ± 0.34 mm, P = 0.32) were similar for both groups. Maximal implantation pressure was slightly higher in the SES group (14.1 ± 2.6 vs. 13.4 ± 2.7 atm, P = 0.21).
Baseline clinical characteristics among non-intravascular ultrasound participants and intravascular ultrasound participants in the SIRTAX study, and among patients with and without incomplete stent apposition in the intravascular ultrasound study
| SIRTAX study (n = 972) | IVUS study (n = 194) | |||||
|---|---|---|---|---|---|---|
| Patients | IVUS (n = 194) | Non-IVUS (n = 778) | P-value | ISA (n = 37) | Non-ISA (n = 157) | P-value |
| Age, mean ± SD | 59.5 ± 10.4 | 62.9 ± 11.2 | 0.001 | 58.0 ± 9.3 | 59.9 ± 10.6 | 0.32 |
| Male [n (%)] | 159 (82.0) | 587 (75.5) | 0.055 | 30 (81.1) | 129 (82.2) | 0.88 |
| Hypertension [n (%)] | 105 (54.1) | 493 (63.4) | 0.018 | 16 (43.2) | 89 (56.7) | 0.14 |
| Current smoking [n (%)] | 81 (41.8) | 274 (35.2) | 0.091 | 20 (54.1) | 61 (38.9) | 0.09 |
| Diabetes mellitus [n (%)] | 32 (16.5) | 163 (21.0) | 0.17 | 5 (13.5) | 27 (17.2) | 0.59 |
| Dyslipidaemia [n (%)] | 119 (61.3) | 453 (58.2) | 0.43 | 24 (64.9) | 95 (60.5) | 0.62 |
| Family history of CAD [n (%)] | 78 (39.8) | 295 (37.9) | 0.63 | 16 (43.2) | 61 (38.9) | 0.62 |
| Indication at baseline [n (%)] | 0.27 | 0.72 | ||||
| Stable angina pectoris | 104 (53.6) | 364 (46.8) | 18 (48.6) | 86 (54.8) | ||
| ACS—STEMI | 42 (21.7) | 180 (23.1) | 10 (27.0) | 32 (20.4) | ||
| ACS—NSTEMI | 41 (21.1) | 186 (23.9) | ||||
| Unstable | 7 (3.6) | 48 (6.2) | 7 (18.9) | 34 (21.7) | ||
| Multivessel disease [n (%)] | 118 (60.8) | 459 (59.0) | 0.64 | 24 (64.9) | 94 (59.9) | 0.58 |
| LVEF, mean% ± SD | 58.3 ± 10.3 | 56.3 ± 12.1 | 0.029 | 57.1 ± 9.5 | 58.6 ± 10.5 | 0.41 |
ACS, acute coronary syndrome; CAD, coronary artery disease; IVUS, intravascular ultrasound study; LVEF, left ventricular ejection fraction; (N-) STEMI, (non-)ST-segment elevation myocardial infarction; SD, standard deviation.
Intravascular ultrasound findings at 8-month follow-up
Incomplete stent apposition was documented in 39 segments (18% of stented segments) of 37 patients at the 8-month IVUS investigation and constitutes the ISA group. One hundred fifty-seven patients with 182 segments showed no evidence of ISA (non-ISA group). Baseline clinical characteristics were similar for patients with or without ISA (Table 1). Of note, there was no difference with respect to age, diabetes mellitus, dyslipidaemia, and acute coronary syndrome as indication for the index procedure. While baseline angiographic characteristics were comparable for patients with or without ISA, stent length was longer in patients with than without ISA (22.1 ± 11.6 vs. 18.1 ± 8.7 mm, P = 0.048) (Table 2). Intravascular ultrasound data at 8 months are summarized in Table 3. We observed no difference in terms of reference vessel and stented segment CSA, whereas patients with ISA showed a lower degree of stent expansion (0.7 ± 0.2 vs. 0.8 ± 0.2, P = 0.001) (Table 3). Incomplete stent apposition was longer and three times more frequent in SES- than PES-treated segments (Table 4). Similarly, stent-CSA (PES: 7.3 ± 1.9 vs. SES: 6.4 ± 1.8 mm2, P = 0.001) and stent expansion index (PES: 0.87 ± 0.21 vs. SES: 0.77 ± 0.19, P = 0.002) were lower for SES- than PES-treated segments.
Baseline angiographic and procedural characteristics in segments with and without incomplete stent apposition
| Segments | ISA (n = 39) | Non-ISA (n = 182) | P-value |
|---|---|---|---|
| Target vessel, n (%) | 0.68 | ||
| Left anterior descending artery | 15 (39) | 81 (45) | |
| Right coronary artery | 14 (36) | 63 (35) | |
| Left circumflex artery | 10 (26) | 38 (21) | |
| Before procedure | |||
| Lesion length, mm ± SD | 13.6 ± 6.4 | 13.4 ± 7.3 | 0.88 |
| RVD, mm ± SD | 2.82 ± 0.42 | 2.86 ± 0.44 | 0.61 |
| MLD, mm ± SD | 0.35 ± 0.38 | 0.48 ± 0.42 | 0.043 |
| Stenosis, % ± SD | 87.1 ± 14.3 | 83.3 ± 13.5 | 0.12 |
| During procedure | |||
| Type of stent, n (%) | 0.001 | ||
| SES | 28 (72) | 75 (41) | |
| PES | 11 (28) | 107 (59) | |
| Stent diameter, mm ± SD | 2.95 ± 0.30 | 2.96 ± 0.34 | 0.82 |
| Stent length, mm ± SD | 22.1 ± 11.6 | 18.1 ± 8.7 | 0.048 |
| Maximal balloon pressure, atm ± SD | 13.8 ± 2.9 | 14.2 ± 2.6 | 0.48 |
| Maximal balloon diameter/RVD (balloon to artery ratio), mean ± SD | 1.12 ± 0.15 | 1.13 ± 0.20 | 0.27 |
ISA, incomplete stent apposition; MLD, minimal lumen diameter; PES, paclitaxel-eluting stent; RVD, reference vessel diameter; SD, standard deviation; SES, sirolimus-eluting stent. P-values were derived using maximum-likelihood logistic and linear-regression models based on robust standards errors that allowed for the correlation of multiple segments within a patient.
Intravascular ultrasound measurements at 8 months
| Segments | ISA (n = 39) | Non-ISA (n = 182) | P-value |
|---|---|---|---|
| Reference segment | |||
| EEM-CSA, mm2± SD | 15.3 ± 4.7 | 14.4 ± 4.7 | 0.29 |
| Lumen-CSA, mm2± SD | 9.6 ± 3.7 | 8.0 ± 2.8 | 0.015 |
| Stent segment | |||
| EEM-CSA, mm2± SD | 17.1 ± 4.6 | 15.8 ± 4.6 | 0.14 |
| Stent-CSA, mm2± SD | 6.9 ± 1.4 | 6.9 ± 2.0 | 0.83 |
| Minimum Stent-CSA, mm2± SD | 6.2 ± 1.4 | 6.1 ± 1.9 | 0.86 |
| Minimum Stent-CSA <5 mm2, n (%) | 4 (10.3) | 44 (24.2) | 0.061 |
| Stent expansion ±SD | 0.7 ± 0.2 | 0.8 ± 0.2 | 0.001 |
| Remodelling index ±SD | 1.3 ± 0.3 | 1.3 ± 0.7 | 0.68 |
| In-stent lumen-CSA, mm2 ±SD | 6.9 ± 1.4 | 6.7 ± 1.9 | 0.50 |
| NIH, mm2 ±SD | 0.1 ± 0.2 | 0.2 ± 0.5 | 0.004 |
| Percentage of stent volume obstruction, % ±SD | 1.3 ± 2.3 | 2.8 ± 5.0 | 0.004 |
CSA, cross-sectional area; EEM, external elastic membrane; ISA, incomplete stent apposition; NIH, neointimal hyperplasia; SD, standard deviation. P-values were derived using maximum-likelihood logistic and linear-regression models based on robust standards errors that allowed for the correlation of multiple segments within a patient.
Incomplete stent apposition in paclitaxel-eluting stents and sirolimus-eluting stents
| Segments | All (n = 221) | PES (n = 103) | SES (n = 118) | P-value |
|---|---|---|---|---|
| ISA, n (%) | 39 (18%) | 11 (9%) | 28 (27%) | 0.001 |
| ISAmax-CSA, mm2 | 4.6 ± 5.0 | 5.0 ± 5.1 | 4.5 ± 5.0 | 0.90 |
| Total ISA length, mm | 1.9 ± 1.4 | 1.0 ± 0.9 | 2.3 ± 1.4 | 0.003 |
| Maximal ISA depth, mm | 0.8 ± 0.5 | 0.8 ± 0.6 | 0.8 ± 0.4 | 0.89 |
| Maximal ISA angle, ° | 114 ± 60 | 92 ± 42 | 120 ± 63 | 0.076 |
| Coronary aneurysm, n (%) | 2 (1%) | 0 (0%) | 2 (2%) | 0.57 |
CSA, cross-sectional area; ISA, incomplete stent apposition; ISAmax-CSA, maximal ISA-CSA; PES, paclitaxel-eluting stent; SES, sirolimus-eluting stent. P-values were derived using maximum-likelihood logistic and linear-regression models based on robust standards errors that allowed for the correlation of multiple lesions within a patient. P-value for coronary aneurysm is based on Fisher's exact test.
Clinical outcomes
The long-term clinical outcomes through 5 years of patients with and without IVUS investigation at 8 months as well as of patients with and without ISA dare summarized in Table 5. Compared with patients who did not undergo IVUS at 8 months, those with IVUS had a lower rate of MACE (12.4 vs. 21.9%, HR = 0.53, 95% CI: 0.34–0.81, P = 0.003), cardiac death (1.0 vs. 7.1%, HR = 0.14, 95% CI: 0.03–0.57, P = 0.001) and a trend towards fewer MIs (4.1 vs. 7.2%, HR = 0.47, 95% CI: 0.26–1.14, P = 0.10), but a similar risk of definite ST (3.1 vs. 4.5%, HR = 0.65, 95% CI: 0.27–1.56, P = 0.33).
Clinical outcomes
| IVUS | Non-IVUS | HR (95% CI) | P-value | ISA | Non-ISA | HR (95% CI) | P-value | |
|---|---|---|---|---|---|---|---|---|
| No. of patients | 194 | 778 | 37 | 157 | ||||
| From stent implantation to IVUS investigation at 8 months | ||||||||
| Death | 0 (0) | 15 (1.9) | 0.13 (0.01–2.11) | 0.052 | 0 (0) | 0 (0) | — | |
| Cardiac death | 0 (0) | 10 (1.3) | 0.19 (0.01–3.20) | 0.23 | 0 (0) | 0 (0) | — | |
| MI | 0 (0) | 29 (3.7) | 0.07 (0.00–1.06) | 0.003 | 0 (0) | 0 (0) | — | |
| Death or MI | 0 (0) | 42 (5.4) | 0.04 (0.00–0.72) | <0.001 | 0 (0) | 0 (0) | — | |
| Clinically driven TLR | 6 (3.1) | 46 (5.9) | 0.51 (0.22–1.19) | 0.11 | 0 (0) | 6 (3.8) | 0.31 (0.02–5.40) | 0.60 |
| Clinically driven TVR | 7 (3.6) | 52 (6.7) | 0.52 (0.24–1.15) | 0.10 | 0 (0) | 7 (4.5) | 0.27 (0.02–4.58) | 0.35 |
| MACE | 6 (3.1) | 63 (8.1) | 0.37 (0.16–0.85) | 0.015 | 0 (0) | 6 (3.8) | 0.31 (0.02–5.40) | 0.60 |
| From stent implantation to 5 years | ||||||||
| Death | 3 (1.5) | 97 (12.5) | 0.12 (0.04–0.37) | <0.001 | 0 (0) | 3 (1.9) | 0.59 (0.03–11.2) | 1.00 |
| Cardiac death | 2 (1.0) | 55 (7.1) | 0.14 (0.03–0.57) | 0.001 | 0 (0) | 2 (1.3) | 0.83 (0.04–16.9) | 1.00 |
| MI | 8 (4.1) | 56 (7.2) | 0.54 (0.26–1.14) | 0.10 | 5 (13.5) | 3 (1.9) | 7.53 (1.79–31.6) | 0.001 |
| Death or MI | 11 (5.7) | 144 (18.5) | 0.29 (0.15–0.53) | <0.001 | 5 (13.5) | 6 (3.8) | 3.75 (1.14–12.3) | 0.019 |
| Clinically driven TLR | 19 (9.8) | 111 (14.3) | 0.64 (0.40–1.05) | 0.07 | 6 (16.2) | 13 (8.3) | 1.94 (0.74–5.09) | 0.17 |
| Clinically driven TVR | 27 (13.9) | 133 (17.1) | 0.76 (0.50–1.15) | 0.20 | 7 (18.9) | 20 (12.7) | 1.48 (0.63–3.50) | 0.37 |
| MACE | 24 (12.4) | 170 (21.9) | 0.53 (0.34–0.81) | 0.003 | 7 (18.9) | 17 (10.8) | 1.75 (0.73–4.20) | 0.21 |
| From IVUS investigation to 5 years | ||||||||
| Death | 3 (1.5) | 82 (10.5) | 0.14 (0.04–0.44) | <0.001 | 0 (0) | 3 (1.9) | 0.59 (0.03–11.2) | 1.00 |
| Cardiac death | 2 (1.0) | 45 (5.8) | 0.17 (0.04–0.70) | 0.005 | 0 (0) | 2 (1.3) | 0.83 (0.04–16.9) | 1.00 |
| MI | 8 (4.1) | 27 (3.5) | 1.09 (0.50–2.41) | 0.82 | 5 (13.5) | 3 (1.9) | 7.53 (1.79–31.6) | 0.001 |
| Death or MI | 11 (5.7) | 102 (13.1) | 0.40 (0.21–0.74) | 0.003 | 5 (13.5) | 6 (3.8) | 3.75 (1.14–12.3) | 0.019 |
| Clinically driven TLR | 13 (6.7) | 65 (8.4) | 0.74 (0.41–1.34) | 0.31 | 6 (16.2) | 7 (4.5) | 3.60 (1.22–10.7) | 0.013 |
| Clinically driven TVR | 20 (10.3) | 81 (10.4) | 0.91 (0.56–148) | 0.71 | 7 (18.9) | 13 (8.3) | 2.28 (0.91–5.73) | 0.07 |
| MACE | 18 (9.3) | 107 (13.8) | 0.61 (0.37–1.01) | 0.053 | 7 (18.9) | 11 (7.0) | 2.71 (1.05–6.96) | 0.031 |
| ARC-definite stent thrombosis | ||||||||
| Early | 0 (0) | 15 (1.9) | 0.13 (0.01–2.11) | 0.052 | 0 (0) | 0 (0) | — | |
| Late | 0 (0) | 3 (0.4) | 0.57 (0.03–11.0) | 1.0 | 0 (0) | 0 (0) | — | |
| Very late | 6 (3.1) | 17 (2.3) | 1.31 (0.52–3.33) | 0.57 | 5 (13.5) | 1 (0.6) | 23.2 (2.65–203) | <0.001 |
| Overall | 6 (3.1) | 35 (4.5) | 0.65 (0.27–1.56) | 0.33 | 5 (13.5) | 1 (0.6) | 23.2 (2.65–203) | <0.001 |
| ARC-definite or probable stent thrombosis | ||||||||
| Early | 0 (0) | 16 (2.1) | 0.12 (0.01–1.97) | 0.053 | 0 (0) | 0 (0) | — | |
| Late | 0 (0) | 3 (0.4) | 0.57 (0.03–11.0) | 1.0 | 0 (0) | 0 (0) | — | |
| Very late | 7 (3.7) | 17 (2.3) | 1.53 (0.64–3.70) | 0.34 | 5 (13.5) | 2 (1.3) | 11.6 (2.21–60.6) | 0.0002 |
| Overall | 7 (3.6) | 36 (4.7) | 0.74 (0.33–1.67) | 0.47 | 5 (13.5) | 2 (1.3) | 11.6 (2.21–60.6) | 0.0002 |
ARC, Academic Research Consortium; ISA, incomplete stent apposition; MACE, Major adverse clinical events: cardiac death, myocardial infarction and TLR, target-lesion revascularization; TVR, target-vessel revascularization. HR, hazard ratios using the Mantel–Cox method. Relative risks were calculated after a continuity correction of 0.5 when one of the cell sizes was zero; P-values are from two-sided Fisher's exact test.
At 5 years of follow-up, 24 patients (12.4%) of the overall IVUS group had suffered from at least one MACE event. There were no significant differences regarding overall mortality, cardiac death, TLR, TVR, and MACE among patients with or without ISA. However, MI was more common among patients with than without ISA (13.5 vs. 1.9%, HR = 7.53, 95% CI: 1.79–31.6, P = 0.001). Figure 2 shows the cumulative frequency of MACE and the composite of cardiac death or MI up to 5 years. In terms of cardiac death or MI, we did not observe any difference between patients with and without ISA up to 2 years of follow-up. However, event curves did separate beyond 2 years and continued to diverge up to 5 years in disfavour of patients with ISA. The increased rate of MI was directly related to an increased rate of very late ST in patients with ISA when compared with those without ISA (ARC-definite ST: 13.5 vs. 0.6%, HR = 23.2, 95% CI: 2.65–203, P < 0.001). We observed no significant difference in the rate of ST between the two stent types [SES 4 (4.4%) when compared with PES 2 (1.9%), HR = 0.44 95% CI: 0.08–2.43, P = 0.34]. Figure 3 demonstrates examples of patients with incidental ISA documented at the 8-month follow-up suffering from very late ST during the subsequent clinical follow-up period.
Kaplan–Meier cumulative event curves (%) for patients with (black line) and without (dashed line) incomplete stent apposition. The vertical dashed line marks the 8-month intravascular ultrasound study. (A) Major adverse clinical events: cardiac death, myocardial infarction, and target-lesion revascularization. (B) Myocardial infarction or cardiac death. (C) Definite stent thrombosis. IVUS, intravascular ultrasound; ISA, incomplete stent apposition; PCI, percutaneous coronary intervention.
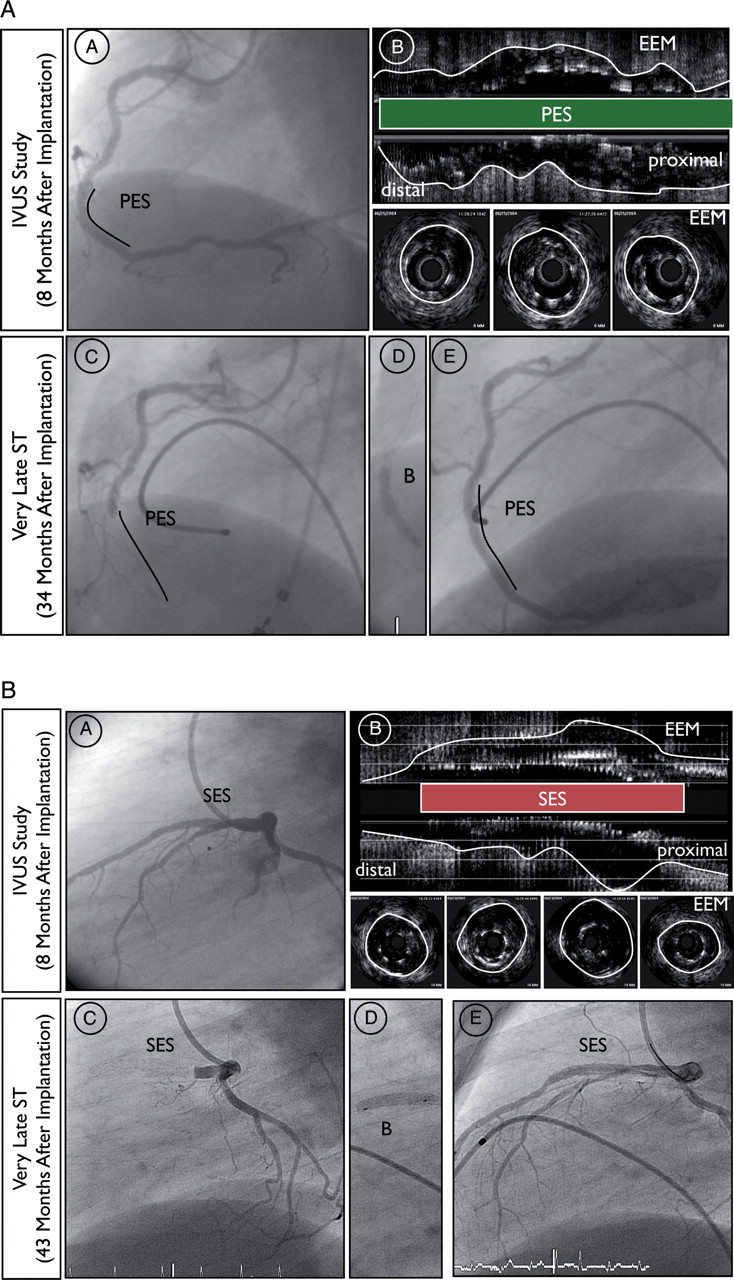
Examples of very late ST in patients with incidental incomplete stent apposition documented at 8-month angiographic follow-up. (A) Angiographic and (B) intravascular ultrasound findings at the 8-month follow-up (C) angiographic findings before, (D) during and (E) at the end of the revascularization procedure at the time of very late ST. (A) Angiographic and intravascular ultrasound findings 8 months after primary PCI with implantation of paclitaxel-eluting stent in the right coronary artery of a 53-year-old male treated for acute inferior ST-elevation MI. The clinical follow-up was complicated by very late ST 34 months after the index procedure (26 months after angiographic follow-up). (B) Angiographic and intravascular ultrasound findings 8-month after PCI with implantation of sirolimus-eluting stunt in the left anterior descending artery of a 43-year-old male treated for a non-ST elevation MI. The clinical follow-up was complicated by very late ST 43 months after the index procedure (35 months after angiographic follow-up). EEM, external elastic membrane; IVUS, intravascular ultrasound; PES, paclitaxel-eluting stent; SES, sirolimus-eluting stent; ST, stent thrombosis.
Discussion
The present study with the longest reported follow-up of patients with incidentally discovered ISA has the following principal findings:
Compared with the unselected all-comer patient population included into the SIRTAX trial, patients enrolled in the IVUS substudy had a lower cardiovascular risk profile and consequently showed a lower risk of MACE during extended clinical follow-up.
The presence of ISA as detected by IVUS at 8 months after DES implantation is associated with an impaired clinical outcome. The increased risk of death or MI was directly related to the increased risk of very late ST.
Selection bias of patients included into the intravascular ultrasound substudy
Enrollment into the IVUS substudy was limited to the first 234 patients included into the SIRTAX trial returning for follow-up angiography at 8 months. This resulted in a selection bias towards the inclusion of lower risk patients compared with the overall study population. This phenomenon has been previously observed in some19,20 but not all9,21,22 IVUS studies and has been related to the omission of IVUS among patients with severely obstructive vessels and among patients with MACE.
Incidence of incomplete stent apposition
Incomplete stent apposition was found in 18% of the patients in the current analysis and was particularly frequent (approximately one-quarter) among patients treated with SES, a finding that is consistent with previous reports. In the RAVEL study, 21% of SES-treated segments showed evidence of ISA.9 In a pooled analysis of 180 SES included into RAVEL, e-SIRIUS, and SIRIUS, Hoffmann et al.23 reported a 25% incidence of ISA after SES implantation. The incidence of ISA 6–9 months after implantation of PES has been reported to range from 4.4 to 8.0% in the TAXUS-II and -IV trials.14,24,25 One possible explanation of an increased incidence of ISA in SES-compared with PES-treated segments may be the lower reported rate of late loss in SES compared with PES. The other possible explanation may be related to inhomogeneous stent expansion at the time of stent implantation or chronic recoil. Thus, we observed smaller stent-CSA, stent expansion index and in-stent lumen-CSA with SES than PES despite a similar stent diameter and a somewhat higher implantation pressure with SES. These findings are consistent with data previously reported by Cheneau et al.25
Incomplete stent apposition and stent thrombosis
Very late ST after coronary stent implantation is a complex and multifactorial process. Incomplete stent apposition has been associated with delayed endothelial healing and drug-induced hypersensitivity reactions with exaggerated positive vessel remodelling. The impact of ISA on the long-term clinical outcome has been the subject of debate since its initial description.26 Several studies have used IVUS to describe morphological changes of arterial structure among patients presenting with very late ST. Feres et al.27 and two previous reports from our group3,4 found an exceedingly high rate of ISA among patients presenting with very late ST. In these patients, ISA was not only found to be much more frequent but also characterized by a larger CSA with evidence of vessel remodelling. The correlation between the extent of inflammatory infiltrates as obtained from thrombus aspirates and evidence of vessel remodelling by IVUS suggested a link between the presence of ISA and the pathogenesis of very late ST.28
In contrast, ISA as incidentally observed during routine IVUS investigation in asymptomatic patients may be related to various causes such as inhomogeneous stent expansion, dissolution of thrombus behind the stent struts or stent recoil, and its impact on the clinical outcome remains incompletely understood.2,3 Several previous reports failed to demonstrate a significant adverse effect of ISA on the clinical outcome during short- to mid-term follow-up up to 12 months.8,10,14,17,29 However, ISA may affect the clinical course only during longer-term follow-up especially as it relates to the incidence of very late ST. Three studies suggest an association between the observed presence of ISA and subsequent adverse events during long-term examination up to 4 years. Hoffmann et al.23 found ISA in 45 of 180 SES segments and in 12 of 145 BMS segments at 6–8 months IVUS follow-up. Although the authors observed no difference in MACE, the rate of MI was significantly higher among patients with ISA than without ISA (16 vs. 5%, P = 0.02). Moreover, the only single very late ST event occurred in the ISA group (P = NS). Qian et al.30 discovered ISA in 13 of 76 patients (17%) at 6 months after DES implantation. At 34 ± 5-month follow-up, 3 of 13 patients (23%) with ISA suffered from very late ST, MI, and TLR, and one patient died during the hospitalization. In a study of 195 patients investigated with IVUS at baseline and at 6–8-month follow-up, Siqueira et al.5 reported the clinical outcome of 13 patients (6.7%) with persistent ISA and 10 patients (5.1%) with late acquired ISA during a mean follow-up of 29 ± 15 months. Patients with late acquired ISA were significantly more prone to very late ST (20 vs. 0%, P = 0.002), TLR (20 vs. 0.6%, P = 0.007), and MI (20 vs. 0%, P = 0.002) than patients without ISA (n = 172) in this study. Finally, a meta-analysis of 17 trials showed an increased risk of ST in patients with late acquired ISA compared with those without ISA (odds ratio: 6.51, 95% CI: 1.34–34.91, P = 0.02).31
Incomplete stent apposition and restenosis
We found no significant difference regarding the risk for revascularization and MACE between patients with or without ISA. This is likely explained by the fact that the increased rate of ST in the ISA group was balanced by more frequent revascularization procedures in the non-ISA group. This finding is in line with reports from Hong et al.8 and Kimura et al.29 who observed less intimal hyperplasia in the presence of ISA.
Study limitations
Several limitations require consideration when interpreting the results of the present study. The most important limitation is the lack of a reference IVUS examination at baseline, which precludes any conclusion regarding the cause of ISA found at IVUS follow-up, particularly as it relates to the assessment of late acquired ISA. Moreover, it should be acknowledged that the number of patients included into this IVUS study is relatively small and therefore underpowered to evaluate safety endpoints and predictors of ISA. In addition, the patients who underwent an 8-month IVUS investigation were at lower risk compared with patients who did not undergo an 8-month IVUS investigation in the SIRTAX trial. Nevertheless, we observed more frequent clinical events in patients with ISA than without ISA. Finally, ISA has been delineated using IVUS, and the use of new intravascular imaging techniques with superior resolution may provide more insight into the morphology and clinical sequelae of ISA.
Conclusion
In the present study, the presence of ISA as assessed by IVUS 8 months after DES implantation was associated with a higher rate of MI and ST during long-term follow-up through 5 years. Incomplete stent apposition appears to be one of multiple factors accounting for the ongoing risk of very late ST after DES implantation, and its prognostic impact requires further investigation.
Funding
This work was supported by intramural research grants from Bern University Hospital and University Hospital Zurich and a grant to T.L., P.J. and S.W. by the Swiss National Science Foundation (Grant 33CM30-124112). There was no industry involvement in the design, conduct, or analysis of the study.
Conflict of interest: B.M. receives research grants and speaker fees from Abbott, Boston Scientific, Medtronic, and Johnson and Johnson. S.W. receives lecture and consulting fees from Abbott, Boston Scientific, Biosensors, Cordis, and Medtronic. All other authors declare that they have no conflict of interest.
References
Author notes
These authors contributed equally to this article.

