Article Text

Abstract
Objective To develop and validate a contemporary clinical risk score to predict mortality after percutaneous coronary intervention (PCI).
Methods Using data collected from patients undergoing PCI at the South Yorkshire Cardiothoracic Centre, Sheffield, UK, between January 2007 and September 2013, a risk score was developed to predict mortality. Logistic regression was used to evaluate the effect of each variable upon 30-day mortality. A backwards stepwise logistic regression model was then used to build a predictive model. The results were validated both internally and externally with data from Manchester Royal Infirmary, UK. 30-Day mortality status was determined from the UK Office of National Statistics.
Results The development data set comprised 6522 patients from Sheffield. Five risk factors, including cardiogenic shock, procedural urgency, history of renal disease, diabetes mellitus and age, were statistically significant to predict 30-day mortality. The risk score was validated internally on a further 3290 patients from Sheffield and externally on 3230 patients from Manchester. The discrimination of the model was high in the development (C-statistic=0.82, 95% CI 0.79 to 0.85), internal (C-statistic=0.81, 95% CI 0.76 to 0.86) and external (C statistics=0.90, 95% CI 0.87 to 0.93) cohorts. There was no significant difference between observed and predicted mortality in any group.
Conclusion This contemporary risk score reliably predicts 30-day mortality after PCI using a small number of clinical variables obtainable prior to the procedure, without knowledge of the coronary anatomy.
- risk stratification
- interventional cardiology
- coronary intervention(PCI)
This is an Open Access article distributed in accordance with the Creative Commons Attribution Non Commercial (CC BY-NC 4.0) license, which permits others to distribute, remix, adapt, build upon this work non-commercially, and license their derivative works on different terms, provided the original work is properly cited and the use is non-commercial. See: http://creativecommons.org/licenses/by-nc/4.0/
Statistics from Altmetric.com
Key questions
What is already known about this subject?
There are numerous risk scores that exist to predict mortality post-percutaneous coronary intervention (PCI). The area is well studied and multiple authors have found that numerous variables significantly predict both in-hospital and 30-day mortality. But they are rarely used. Why? Most are too complex and do not use exclusively clinical variables readily available before taking the patient to the catheterisation laboratory.
What does this study add?
In this study, we show that an accurate estimation of 30-day mortality post-PCI can be achieved with a relatively small number (five) of variables that are all obtainable prior to intervention.
How might this impact on clinical practice?
We envisage that the risk score described here would allow patients and doctors to be fully informed before the procedure. We also foresee that the model would be an appropriate tool to protect operators from falsely elevated adverse outcome statistics, and to protect patients from risk-averse behaviour. The risk score could also be used to help stratify mortality data for operators and centres. Uniquely among risk scores that predict 30-day mortality, the model described here is unlikely to be incomplete or impossible to calculate, owing to the small number of readily ascertainable variables.
Introduction
Risk scores to predict mortality after percutaneous coronary intervention (PCI) have been present for decades. Initially designed to aid patient decisions, more recently, they have been used to allow for adjustment of operator and institutional mortality statistics and protect against risk-averse behaviour and litigation.1 2 Several risk scores can predict mortality, some using a large number of variables, some of which are not obtainable prior to angiography, some not reflecting contemporary PCI practice and others locally valid but untested elsewhere.3–11 A contemporary risk score comprising few, simpler variables, available to the operator prior to starting PCI, especially because many PCI procedures are conducted in an acute setting, would be ideal.
The objective of this study was to develop and validate, both internally and externally, a preprocedural risk score that is valid in the modern era, and predicts 30-day mortality post-PCI.
Methods
Data collection
The original data set comprised all patients who underwent PCI at the South Yorkshire Cardiothoracic Centre, Sheffield, UK. Sheffield is a tertiary centre providing all the PCI procedures for a population of ~1.8 million in the north of England. A standard panel of risk factors derived from previous risk scores was recorded using a dedicated database. This was a retrospective analysis of a prospectively kept database. The patient cohort was randomly divided into development (two-thirds) and validation (one-third) data sets and their 30-day mortality was determined from the UK Office of National Statistics. External validation was then performed by recalibrating the risk score using a technique described by Wu et al 3 and applying it to similar data from Manchester Royal Infirmary, Manchester, UK.
Clinical variables and outcomes
Demographic and clinical data comprising a number of clinically relevant risk factors were collected prospectively. Diabetes mellitus included both insulin-dependent and non-insulin-dependent types. Renal disease was labelled when serum creatinine was >200 µmol/L at the beginning of the PCI procedure, the patient was on regular dialysis or had undergone renal transplant; the absence of proof of renal disease was labelled as no history of renal disease. Cardiogenic shock was defined as signs of hypoperfusion (cold peripheries, altered mental state and oliguria) with a systolic blood pressure <90 mm Hg or one maintained artificially. Procedural urgency was categorised as elective, urgent or emergent: elective were planned procedures performed on stable patients; urgent were procedures performed on inpatients for unstable angina or non-ST segment elevation myocardial infarction; emergent procedures were immediate procedures usually performed for ST segment elevation myocardial infarction.
The study outcome was 30-day mortality of any cause.
Statistical analysis
Logistic regression was used to evaluate the effect of each variable on 30-day mortality. Variables available prior to intervention found to affect 30-day mortality at univariate analysis at the level p<0.10 were then entered into a backwards stepwise logistic regression model. The variables found to be still significant at the level p<0.10 were retained in the final model. Two models were created, the first using only patients for whom all variables found significant on univariate analysis were available, the second with imputed data in place of the missing variables. A Mersenne Twister random number generator was used to impute five estimations for each missing variable; the modal average was then used in place of the missing values. Analysis of the performance of the risk scores when applied to the development set was undertaken using a receiver operator characteristic curve C-statistic12 to assess discrimination, and the Hosmer-Lemeshow goodness-of-fit test to assess calibration.13 The unimputed model was later used for a further internal validation which was undertaken by applying the risk score to patients from the Sheffield validation set and the results were analysed using identical techniques. This process was then repeated using the external (Manchester) validation cohort once the risk score was recalibrated to the data. Assessment of the models was undertaken using the data sets for which there was no missing risk model variables. All analyses were performed using SPSS V.21.0.
Results
The baseline group comprised 10 169 patients from Sheffield who underwent PCI between January 2007 and September 2013, of which 6779 were in the development group and 3390 in the validation group. The external validation group was made up of 4899 patients from Manchester who underwent PCI between January 2012 and December 2014. After exclusions of patients with incomplete data (see online supplementary table 1), 6522 patients remained in the development set, 3290 in the internal validation set and 3230 patients in external validation set.
Supplementary file 1
There were 171 (2.5%) deaths within 30 days in the development group (153 after exclusions (2.3%)), 75 (2.3%) in the internal validation group after exclusions and 64 (2.0%) in the external validation group after exclusions. Characteristics of the three groups are shown in table 1.
Patient characteristics for patients in the development (with and without exclusions), internal and external validation sets and crude 30-day mortality rates. Results for the internal and external validation cohorts were calculated after the exclusion of missing variables required for completing the risk score
At univariate analysis of the development set, five variables were found to significantly impact mortality: cardiogenic shock (OR=20.1, 95% CI 11.6 to 35.1), emergent procedure (OR=10.5, 95% CI 5.8 to 19.0), history of renal disease (OR=5.0, 95% CI 2.6 to 9.5), diabetes (OR=1.6, 95% CI 1.1 to 2.4) and age (OR=1.1 for each year, 95% CI 1.0 to 1.1).
Missing data for 257 patients in the development set were imputed and the results were entered into a backwards stepwise logistic regression model. A similar model was produced excluding the 257 patients for whom all variable data were not present (n=6522); the results of which are shown in table 2.
Results of the unimputed multivariate logistic regression model
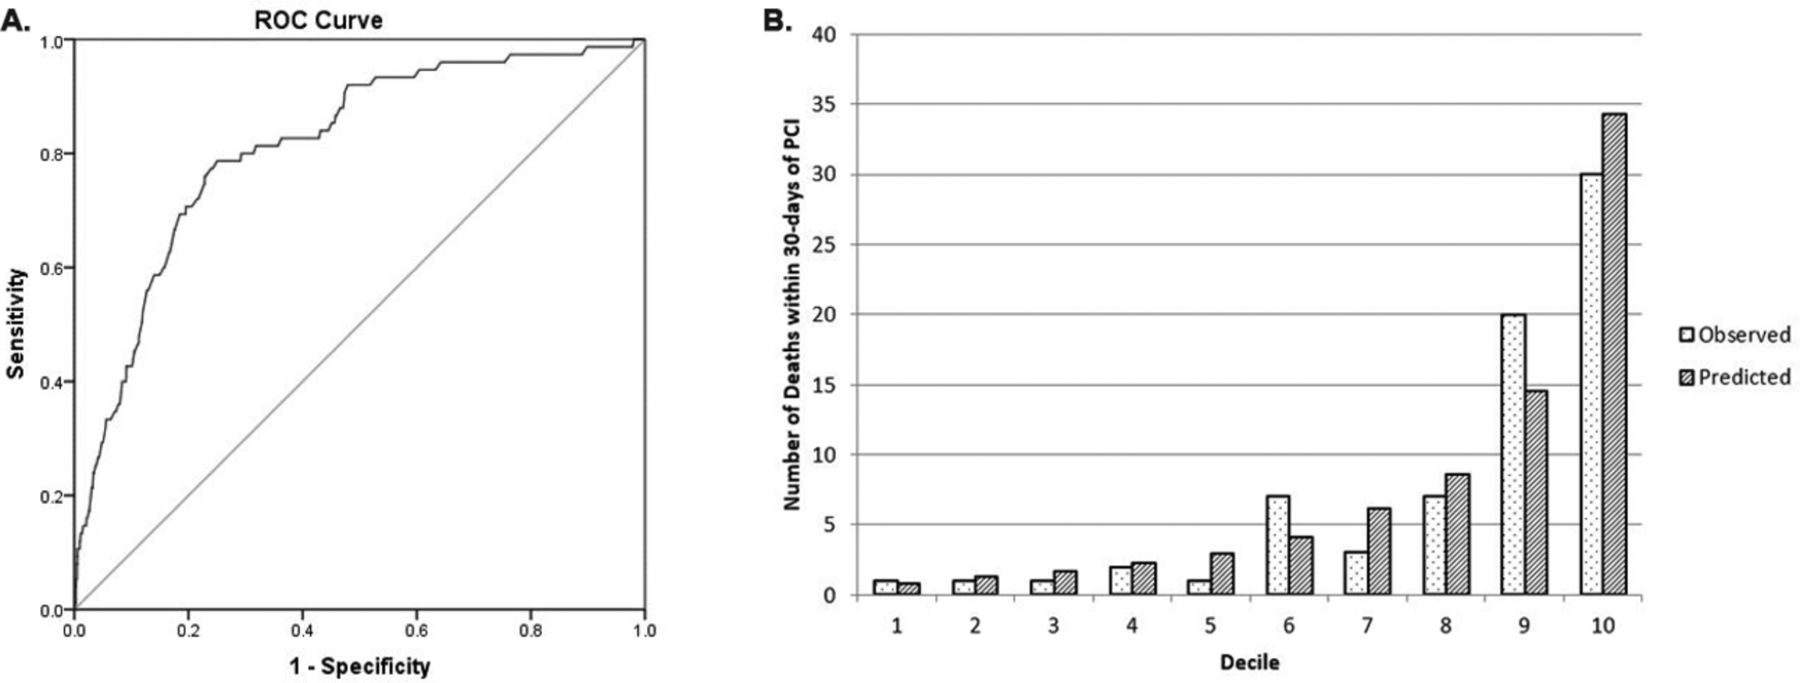
The unimputed and imputed models performed similarly when applied to the development set. The discrimination of both models was high14 (unimputed: C-statistic=0.82, 95% CI 0.79 to 0.85, figure 1A; imputed: C-statistic=0.82, 95% CI 0.79 to 0.85, figure 1B) , and both models were well calibrated, predicting 157 and 162 deaths, respectively; 153 were observed. Hosmer-Lemeshow p values of 0.71 (unimputed) and 0.32 (imputed) confirmed no significant difference between observed and predicted mortality for either model (unimputed, figure 1C; imputed, figure 1D). As both models performed similarly well, the unimputed model was selected for further analysis.

(A) Illustration of the receiver operating characteristic (ROC) curve (discrimination) of the unimputed model on the development set data. C-statistic: 0.82 (95% CI 0.79 to 0.85). (B) Illustration of the ROC curve (discrimination) of the imputed model on the development set data. C-statistic: 0.82 (95% CI 0.79 to 0.85). (C) Illustration of the Hosmer-Lemeshow goodness-of-fit test of mortality observed versus that predicted by the unimputed model by decile of predicted risk in the development set: p value=0.71. (D) Illustration of the Hosmer-Lemeshow goodness-of-fit test of mortality observed versus that predicted by the imputed model by decile of predicted risk in the development set: p value=0.32. PCI, percutaneous coronary intervention.
Equation 1 shows the risk score derived from the unimputed backwards stepwise logistic regression, where p=the probability of death within 30 days of undergoing PCI.

where Age, age of patient; CGS, presence (1) or absence (0) of cardiogenic shock; D, presence (1) or absence (0) of diabetes mellitus; HxR, presence (1) or absence (0) of a history of renal disease; U1 and U2, urgency of procedure (elective: U1=0, U2=0; urgent U1=1, U2=0; emergent: U1=0, U2=1).
For example, a 75-year-old patient who presented in cardiogenic shock, had no history of diabetes or renal disease and was treated emergently would have log odds=−8.673 + 0.052*(75)+2.044 + 2.168=−0.561. This can be converted into a probability: p= e-0.561/1+e-0.561= 0.363 (36.3%).
The risk model was then applied to the internal validation set. The discrimination of the model was high (C-statistic=0.81, 95% CI 0.76 to 0.86; figure 2A) and the model was well calibrated, because the risk score predicted 77 deaths and 73 occurred. A Hosmer-Lemeshow p=0.39 confirmed no significant difference between observed and predicted mortality (figure 2B).

(A) Illustration of the receiver operating characteristic (ROC) curve (discrimination) of the model on the internal validation set data. C-statistic: 0.81 (95% CI 0.76 to 0.86). (B) Illustration of the Hosmer-Lemeshow goodness-of-fit test for observed versus predicted mortality by decile of predicted risk in the internal validation set: p value= 0.39. PCI, percutaneous coronary intervention.
The model was then recalibrated and applied to the external validation set. The discrimination of the model was high (C-statistic=0.90, 95% CI 0.87 to 0.93; figure 3A) and the model was well calibrated; predicted deaths=64, observed=64. A Hosmer-Lemeshow p=0.07 confirmed no significant difference between observed and predicted mortality (figure 3B).

(A) Illustration of the receiver operating characteristic (ROC) curve (discrimination) of the recalibrated model on the external validation set data. C-statistic: 0.90 (95% CI 0.87 to 0.93). (B) Illustration of the Hosmer-Lemeshow goodness-of-fit test for observed versus predicted mortality by decile of predicted risk in the external validation set: p value=0.07. PCI, percutaneous coronary intervention.
For ease of use, the risk score was then developed into a nomogram described in table 3 and figure 4.
A table to calculate the risk of a specific patient. To be used in conjunction with figure 4

A graph describing the relationship between the calculated value of final score derived from table 3and the probability of death within 30 days of undergoing percutaneous coronary intervention (PCI).
Discussion
In this study, we have developed and validated a simple risk score that can predict 30-day mortality after PCI and does not require knowledge of the coronary anatomy. The final five variables that make up the risk score (cardiogenic shock, advanced age, procedural urgency, history of renal disease and diabetes mellitus) are all known prior to intervention and are readily ascertainable.
The variables in the model have been shown to impact outcomes and are used in other risk scores.3–9 11 Cardiogenic shock is one of the most powerful predictor of adverse outcomes.15 16 Increasing age is associated with an increase in cardiovascular mortality, as well as being a surrogate for comorbidities17 18 which have been associated with an increased 30-day mortality post-PCI.19 20 Urgency is used in the risk score as a surrogate for acuity of presentation which is associated with adverse outcomes. Renal impairment has been associated with an increase in mortality post-PCI.21 and diabetes mellitus confers an increased risk of cardiac mortality.22Left ventricular ejection fraction has been included as a variable in a number of scores to predict outcomes post-PCI.3 4 6 9 However, it was excluded from our analysis as it is seldom known prior to intervention.
A widely used PCI risk score in the UK is the North West Quality Improvement Programme (NWQIP) model, which was developed on data from over a decade ago. However, it is reassuring to observe that three out of five predictors in our model (age, urgency and cardiogenic shock) were also in the NWQIP model, despite a change in case mix, technology and management strategy over the intermediate years.5 Another model widely used is US-based New York risk score and its more contemporary iteration published in 2013. The strength of this model includes derivation form a very large data set (n=46 090 and n=54 223, respectively). However, due to differences in population mix and management between the USA and Europe including UK, the risk scores may not necessarily be applicable to non-US practice. Integer risk scores such as the Toronto score are no longer necessitated in the modern era of computed recording and prediction.6 Nevertheless, we also found common variables between UK and North American scores.3 4 7
With the exception of the model produced by McAllister et al, no complete prediction of outcome can be ascertained prior to intervention, using only clinical variables. The model took advantage of a large data set and was developed using results from multiple centres across the UK. Both models include age, diabetes, renal disease, indication/urgency and cardiogenic shock as predictors of outcome. Interestingly, our model compares favourably (validation C-statistic: 0.86 vs 0.90, (95% CI 0.87 to 0.93); H-L: both non-significant) despite requiring four fewer variables suggesting that the data that were used to develop the model is in line with UK practice and could therefore potentially be applied widely.11 Overall, the performance of the model was favourable in comparison with all other risk scores that predict outcome post-PCI in terms of discriminating between those who did and did not die within 30 days (C-statistic) and in terms of predicted versus observed 30-day mortality (non-significant Hosmer- Lemeshow).3–9 11
There was an increase in the discrimination ability of the model described here in the external validation cohort (C-statistic=0.90, 95% CI 0.87 to 0.93) compared with the development cohort (C-statistic=0.82, 95% CI 0.78 to 0.85) and the internal validation cohort (C-statistic=0.81, 95% CI 0.76 to 0.86). The slightly higher discrimination in the external cohort may be the play of chance. However, following reviewer's comments, we looked at the patient characteristics in the three groups and found that patients in the external cohort had higher proportion of cardiogenic shock (development: 0.9%, internal validation: 0.7%, external validation: 1.7%), diabetes mellitus (development: 14.3%, internal validation: 14.4%, external validation: 20.9%) and history of renal disease (development: 1.6%, internal validation: 1.1%, external validation: 3.5%), all of which are included in the risk model. This may have resulted in better discrimination in this cohort.
Study limitations
The risk model is based on data from a single centre; however, it was validated in another UK centre. Second, the numbers of patients included, while large for an individual centre, are limited by comparison with national data. Third, adverse events were relatively rare among the cohort. Finally, patients for whom variables were missing were not included in the study, though the congruence between the unimputed and imputed models derived from the development set suggest that missing variables in the development cohort were missing at random. More general limitations include the inability to predict an individual’s risk with a high level of accuracy, and the ignorance of rare but significant predictors of outcome such as advanced metastatic disease. For these reasons, this risk score should only be used to guide clinical decisions, not make them, though the risk score may have a role in the adjustment of operator and institutional mortality statistics and protection against risk-averse behaviour and litigation.1 2 The inherent complexity of multivariate logistic regression often, as in this case, leads to a complicated equation. Some authors have dealt with this problem by rounding the OR of a variable to an integer. But variables are routinely entered into a database that is capable of computing a non-integer risk score, so this may be an unnecessary simplification. We also developed a nomogram so a crude estimation of risk could be estimated with a relatively simple calculation.
Clinical implications
There are numerous existing risk scores to predict adverse outcomes after PCI, but this risk score is the only recent model that predicts 30-day mortality using only five variables that are known prior to intervention.3–9 11 The model described here offers a quick and reliable risk prediction that can help PCI operators to make more informed decision. The use of variables known prior to intervention also allows patients to be fully informed before they consent to an invasive procedure with potential risks. In the current era, where PCI outcomes are available to public scrutiny, a risk score is the appropriate tool to protect operators from falsely elevated adverse outcome statistics, and to protect patients from risk-averse decisions.2 23 We believe that in modern practice, there is little added advantage of an integer score. To make calculation easy, we are aiming to develop a mobile/desktop application (app) for this score, which can truly be used at the bedside. In summary, we have developed and validated a clinical risk score for PCI which is easy to use prior to intervention in modern practice.
Acknowledgments
We are grateful to Louisa Yates for database preparation and interrogation of the UK national mortality statistics.
References
Footnotes
Contributors JG originated the idea, supervised the project and critically appraised the manuscript. JG is the guarantor. JJSW analysed the data, developed and validated the risk score and wrote the draft paper. JI assisted with statistical analysis of the data, sourced data for external validation and critically appraised the manuscript. MA assisted with data analysis. DT supervised the statistics. MG, TH, ST and LQ performed preliminary work on risk analysis. ME-O and DGF sourced data for external validation. AS originated a preliminary risk score model and all the above critically appraised the manuscript.
Competing interests None declared.
Patient consent Detail has been removed from this case description/these case descriptions to ensure anonymity. The editors and reviewers have seen the detailed information available and are satisfied that the information backs up the case the authors are making.
Provenance and peer review Not commissioned; externally peer reviewed.