Article Text

Abstract
Objective We explored cardiac volumes and the effects on systolic function in hypertrophic cardiomyopathy (HCM) patients with left ventricular hypertrophy (HCM LVH+) and genotype-positive patients without left ventricular hypertrophy (HCM LVH−).
Methods We included 180 HCM LVH+, 100 HCM LVH− patients and 80 healthy individuals. End-Diastolic Volume Index (EDVI), End-Systolic Volume Index (ESVI) and ejection fraction (EF) were assessed by echocardiography. Left ventricular (LV) global longitudinal strain (GLS) was measured by speckle tracking echocardiography.
Results EDVI and ESVI were significantly smaller in HCM LVH+ compared with HCM LVH− patients (41±14 mL/m2 vs 49±13 mL/m2 and 16±7 mL/m2 vs 19±6 mL/m2, respectively, both p<0.001) and in healthy individuals (41±14 mL/m2 vs 57±14 mL/m2 and 16±7 mL/m2 vs 23±9 mL/m2, respectively, both p<0.001). HCM LVH− patients had significantly lower EDVI and ESVI compared with healthy individuals (49±13 mL/m2 vs 57±14 mL/m2 and 19±6 mL/m2 vs 23±9 mL/m2, both p<0.001). EF was similar (61%±7% vs 60%±8% vs 61%±6%, p=0.43) in the HCM LVH+, HCM LVH– and healthy individuals, despite significantly worse GLS in the HCM LVH+ (−16.4%±3.7% vs −21.3%±2.4% vs −22.3%±3.7%, p<0.001). GLS was worse in the HCM LVH− compared with healthy individuals in pairwise comparison (p=0.001). Decrease in ESVI was closely related to EF in HCM LVH+ and HCM LVH− (R=0.45, p<0.001 and R=0.43, p<0.001) as expected, but there was no relationship with GLS (R=0.02, p=0.77 and R=0.11, p=0.31). Increased maximal wall thickness (MWT) correlated significantly with worse GLS (R=0.58, p<0.001), but not with EF (R=0.018, p=0.30) in the HCM LVH+ patients.
Conclusion HCM LVH+ had smaller cardiac volumes that could explain the preserved EF, despite worse GLS that was closely related to MWT. HCM LVH− had reduced cardiac volumes and subtle changes in GLS compared with healthy individuals, indicating a continuum of both volumetric and systolic changes present before increased MWT.
- Hypertrophic cardiomyopathy
- echocardiography and heart failure with preserved ejection fraction
This is an Open Access article distributed in accordance with the Creative Commons Attribution Non Commercial (CC BY-NC 4.0) license, which permits others to distribute, remix, adapt, build upon this work non-commercially, and license their derivative works on different terms, provided the original work is properly cited and the use is non-commercial. See: http://creativecommons.org/licenses/by-nc/4.0/
Statistics from Altmetric.com
Key messages
What is already known about this subject?
Hypertrophic cardiomyopathy patients with left ventricular hypertrophy (HCM LVH+) and genotype-positive patients without left ventricular hypertrophy (HCM LVH−) typically have normal or elevated ejection fraction (EF), despite decreased longitudinal function.
What does this study add?
Smaller cardiac volumes in patients with HCM are related to preserved EF in HCM LVH+ patients. In HCMLVH− patients there were subtle changes in both volumetric and systolic changes, indicating a continuum of changes from the healthy individuals to HCM LVH− and HCM LVH+ patients. Global longitudinal strain (GLS) was closely related to maximal wall thickness in HCM LVH+ patients.
How might this impact on clinical practice?
HCM LVH− patients with volumetric and systolic changes should be closely followed. GLS is a sensitive parameter for detecting systolic impairment and is related to increased development of the HCM disease.
Introduction
Hypertrophic cardiomyopathy (HCM) is one of the most common inherited cardiomyopathies with an estimated prevalence of 1:500. HCM is characterised by the presence of increased left ventricular (LV) wall thickness that is not explained by abnormal loading conditions with heterogeneous disease development and expression. Sarcomere mutations are identified in 60%–70% of HCM cases.1 Echocardiography is a valuable tool in diagnosis and follow-up of patients with HCM, evaluating morphology, structural abnormalities, haemodynamic disturbances and prognosis.2 3 LV systolic function is closely related to prognosis in cardiac diseases in general.4 LV ejection fraction (EF) is based on volume measurements and is the most widely used metric of LV systolic function despite its inherent weaknesses. EF is typically normal in patients with HCM and may remain normal until the end stage of the disease.5 EF is therefore considered inadequate to evaluate the indication for medical treatment and cardiac transplantation in HCM.1 We know that patients with HCM have decreased longitudinal systolic function despite normal EF and that worse global longitudinal strain (GLS) is associated with poor cardiac outcomes.6–10 However, the mechanism behind normal EF in HCM patients w ith reduced systolic fun ction is not comprehensively described. A possible explanation is that the increased wall thickness results in lower volumes and alter the equation for EF ((end-diastolic volume−end-systolic volume)/end-diastolic volume).
Previous studies have also shown subtle changes in systolic function in genotype-positive patients without left & ventricular hypertrophy (HCM LVH−) despite normal EF.11–13 However, we need more studies to identify morphological features in HCM LVH− patients to identify the patients who should be closely followed.
We aimed to study the relationship between volumetric changes and the paradox of normal EF and decreased longitudinal function by strain echocardiography in a large population of HCM patients with left ventricular hypertrophy (HCM LVH+) and HCM LVH−. We hypothesised that volumetric changes in HCM occur as a continuum from the HCM LVH− to the HCM LVH+.
Methods
Study population
In this cross-sectional study, patients with HCM were consecutively included when appointed at the Unit of Cardiac Genetic Disease in our department from 2005 to 2014.
It is known that LV mass can be normal in patients with HCM,14 and these patients were defined as phenotype positive if they had a ventricular maximal wall thickness (MWT) ≥15 mm with no other obvious explanation for the hypertrophy or MWT of ≥13 mm in the presence of a HCM-related mutation (HCM LVH+).1
Patients with HCM were defined as phenotype negative in the presence of a sarcomere mutation (HCM LVH−) with LV wall thickness <13 mm and no history of cardiac symptoms.
All the patients underwent clinical examination and echocardiography.
Healthy individuals were invited to participate in the study from hospital staff, medical school and research laboratories, and age matched with HCM LVH+ patients. All participants gave written informed consent. The study complied with the Declaration of Helsinki and was approved by the Regional Committees for Medical Research Ethics.
Genetic analyses
DNA sequencing of the genes encoding the sarcomere proteins MYH7 (NM_000257.2), MYBPC3 (NM_000256.3), cardiac troponin I (TNNI3) (NM_000363.4), cardiac troponin T (TNNT2) (NM_001001430.1), myosin ventricular regulatory light chain 2 (MYL2) (NM_000432.3) and myosin ventricular essential light chain 1 (MYL3) (NM_000258.2) has been described previously.15 HCM patients with mutations classified as variants of unknown significance were defined as genotype negative and family members of these were not included.
Echocardiography
Two-dimensional echocardiographic studies were performed on Vivid 7 or Vivid E9 machines (GE Healthcare, Horten, Norway). Data were analysed with EchoPAC version 112 ( GE Healthcare). LV wall thickness was measured from parasternal short-axis view, and MWT was defined as the most hypertrophic segment in all LV segments from the base to the apex of the LV.1 In the HCM LVH+patients, we used the Maron classification (I–IV) to describe the phenotype.16 17 According to the classification, type I was defined as anteroseptal hypertrophy, type II affecting the whole septum , type III the septum and at least part of the LV-free wall and type IV affecting other location as in the apex. The interventricular septal diameter, LV posterior wall diameter, LV end-diastolic diameter (LVEDD), LV end-systolic diameter (LVESD), left atrial diameter and LV mass (Cube formula) were determined by M-mode or 2-D imaging.18 Peak left ventricular outlet tract (LVOT) gradients were measured only at rest, and LVOT obstruction was defined as pressure gradient ≥30 mm Hg.1 LV end-diastolic volume (EDV) and end-systolic volume (ESV) were measured and EF was calculated by Simpson’s formula.18 LV volumes were indexed by body surface area. Diastolic function was evaluated by transmitral pulsed Doppler and tissue Doppler. Early diastolic mitral annular velocity (eʹ) by tissue Doppler in apical four-chamber view was calculated as the average of septal and lateral samplings. Atrial area was measured at end-systole and averaged from apical four-chamber and apical two-chamber views.18
Longitudinal strain by speckle tracking echocardiography was obtained from three apical views at frame rates >50/s. The endocardial border was traced in each view and speckles were tracked frame by frame during the cardiac cycle. Segments that failed to track were manually adjusted, and segments that subsequently failed to track were excluded. Region of interest was adjusted to fit the myocardial thickness. LV GLS was defined as the average of peak longitudinal strain from the 16 LV segments model.19
Statistical analyses
Continuous data were presented as mean±SD. Comparisons of means between groups were performed by unpaired Student’s t-test or analysis of variance F-test with Bonferroni post hoc correction when more than two groups were compared. Proportions were compared by χ2 test or Fisher’s exact test (SPSS version 21). Indexed LV volumes were adjusted for gender and age by multivariate logistic regression. Correla tions between EF, GLS, MWT, End-Systolic Volume Index (ESVI), e′ and cardiac volumes were assessed by linear regression analysis. Interobserver and intraobserver variabilities were expressed by intraclass correlation coefficients. Two-sided p values ≤0.05 were considered statistically significant.
Results
Patient characteristics and genetic analyses
A total of 180 HCM LVH+patients, 100 HCM LVH− patients and 80 healthy individuals were included in the study (table 1).
Clinical characteristics and echocardiographic findings in 80 healthy individuals, 100 HCM LVH− patients and 180 HCM LVH+ patients
The HCM LVH+ patients were more frequently male compared with the HCM LVH− patients (p<0.01). The HCM LVH− patients were younger than the HCM LVH+ patients and the healthy individuals (p<0.001) (table 1). Body mass index was higher in the HCM LVH+ patients than the HCM LVH− patients and the healthy individuals (p<0.001). HCM-related pathogenic mutations were confirmed in 90 (50%) HCM LVH+ patients (59 (66%) MYBP3, 25 (28%) MYH7, 4 (4%) TNNI3 and 2 (2%) TNNT2) and in all 100 HCM LVH− patients as defined in our inclusion criteria (58 (58%) MYBP3, 29 (29%) MYH7, 3 (3%) TNNI3 and 4 (4%) MYL3 and 6 (6%) MYL2).
General echocardiographical findings
As expected, MWT was thicker and the LVOT gradient was higher in the HCM LVH+ patients compared with HCM LVH− patients and healthy individuals (all p<0.001), but with no differences between the HCM LVH− patients and healthy individuals (p=1.0) (table 1). In the HCM LVH+ patients, 18.9% (n=34) presented with a type I, 40.0% (n=72) with a type II, 37.2% (n=67) type III and 3.9% (n=7) type IV hypertrophy pattern according to the Maron classification of HCM phenotype.
The HCM LVH+ patients had smaller LV cavities measured by LVEDD and LVESD compared with HCM LVH− patients (p=0.02 and p<0.001) and healthy individuals (both p<0.001). HCM LVH− patients had smaller LVEDD and LVESD than healthy individuals (p=0.05 and p=0.03) (table 1). Indexed LV mass was significantly higher in the HCM LVH+ patients compared with the HCM LVH− patients and healthy individuals (both p<0.001), but with no differences between the HCM LVH− patients and healthy individuals (p=1.0).
HCM LVH+ patients had increased E deceleration time, E/e′ and atrial area compared with HCM LVH− patients and healthy individuals (all p<0.001), whereas there were no differences between HCM LVH− patients and healthy individuals. HCM LVH− patients had reduced e′ compared with the healthy individuals (p=0.01) (table 2).
LV volumes, EF and diastolic parameters evaluated by echocardiography in 80 healthy individuals, 100 HCM LVH− patients and 180 HCM LVH+ patients
LV volumes and systolic function
End-Diastolic Volume Index (EDVI) was significantly smaller in HCM LVH+ patients than in HCM LVH− patients and healthy individuals (both p<0.001) (table 2). Small EDVI was more likely in HCM LVH+ patients also when adjusting for gender and age, compared with HCM LVH− patients (OR 0.97 (95% CI 0.95 to 0.99), p<0.01) and compared with healthy individuals (OR 0.92 (95% CI 0.89 to 0.94), p<0.001). ESVI was likewise significantly smaller in the HCM LVH+ patients compared with HCM LVH− patients and healthy individuals ( both p<0.001) (table 2). E SVI adjusted for gender and age was smaller in the HCM LVH+ patients compared with healthy individuals (OR 0.88 (95% CI 0.84 to 0.92), p<0.001), but not compared with HCM LVH− patients (OR 0.96 (95% CI 0.91 to 1.00), p=0.09). HCM LVH− patients had significantly lower EDVI and ESVI compared with healthy individuals (both p<0.001) (table 2), also when adjusting for gender and age (OR 0.92 (95% CI 0.89 to 0.94) and (OR 0.88 (95% CI 0.84 to 0.92), both p<0.001) (figure 1).
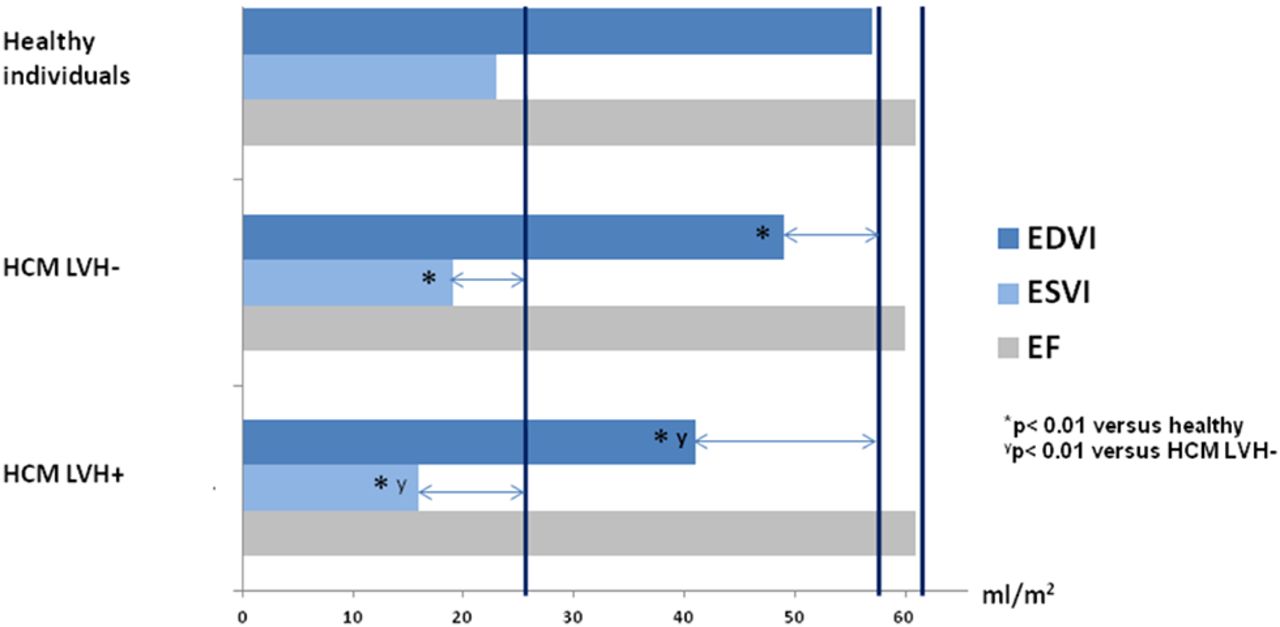
Bar chart of cardiac volumes and EF in the healthy individuals, HCM LVH− patients and HCM LVH+ patients. Blue bars show the indexed diastolic volumes (EDVI (mL/m2)), light blue bars show the indexed systolic volumes (ESVI (mL/m2)) and grey bars show EF (%). The dark blue vertical lines are reference for average EDVI, ESVI and EF in healthy individuals. The horizontal arrows indicate the difference in average indexed diastolic and systolic volumes and EF between HCM LVH− and HCM LVH+ patients compared with healthy individuals. *p<0.01 versus healthy individuals, †p<0.01 versus HCM LVH−. EDVI, End-Diastolic Volume Index; EF, ejection fraction; HCM, hypertrophic cardiomyopathy; ESVI, End-Systolic Volume Index; HCM, hypertrophic cardiomyopathy; HCM LVH−, genotype-positive patients without increased wall thickness; HCM LVH+, patients with increased wall thickness; LVH, left ventricular hypertrophy.
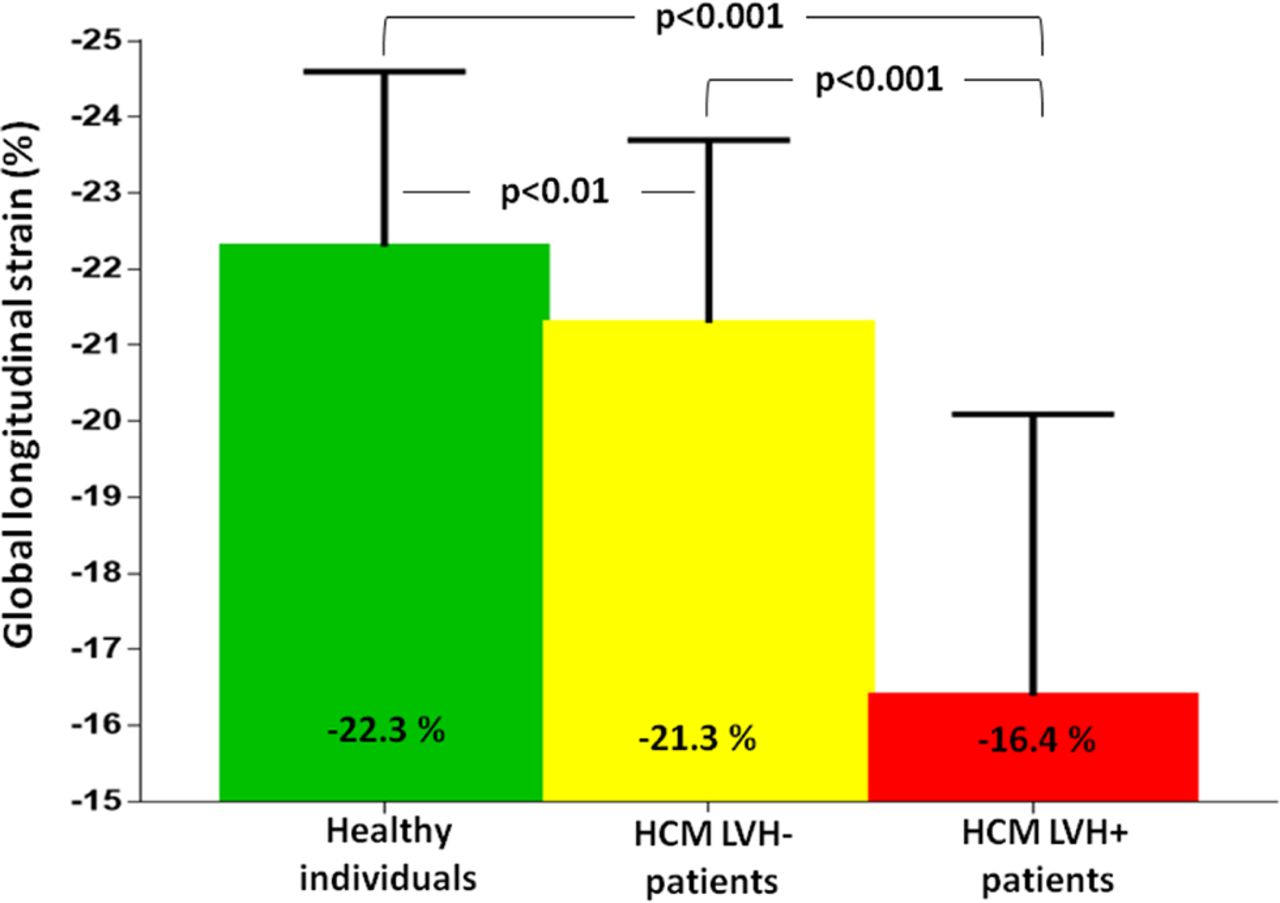
EF did not differ between the HCM LVH+, HCM LVH− and healthy individuals (p=0.43) (table 2), but systolic function evaluated by GLS was worse in HCM LVH+ patients compared with HCM LVH− patients (−16.4%±3.7% vs −21.3%±2.4%, p<0.001) and healthy individuals (−22.3%±3.7%, p<0.001), indicating reduced longitudinal LV systolic function despite normal EF (figure 2). The mutation-negative HCM LVH+ patients had significantly worse GLS than the mutation-positive patients (−15.2%±3.4% vs −17.6%±3.4%, p<0.001), but there were no differences in GLS related to the pathogenic mutations. The GLS was significantly worse with increased distribution of hypertrophy (−18.9%±2.8% in type I, −16.5%±3.2% in type II, −14.7%±3.7% in type III and −19.3%±2.8% in type IV) with significantly worse GLS in type III compared with the other hypertrophy pattern (−14.7%±3.7% vs −17.3±3.3%, p<0.001).

Bar chart of systolic function in healthy individuals, HCM LVH− patients and HCM LVH+ patients. GLS was significantly worse in the HCM LVH+ patients compared with HCM LVH− patients and healthy individuals (both p<0.001). In addition, GLS was worse in the HCM LVH− compared with healthy individuals (p=0.005). GLS, global longitudinal strain; HCM, hypertrophic cardiomyopathy; HCM LVH−, genotype-positive patients without increased wall thickness; HCM LVH+, patients with increased wall thickness; LVH, left ventricular hypertrophy.
GLS was worse in the HCM LVH− patients compared with healthy individuals in pairwise comparison (p=0.001) demonstrating subtle changes in systolic function also in the HCM LVH− patients (table 2) (figure 2).
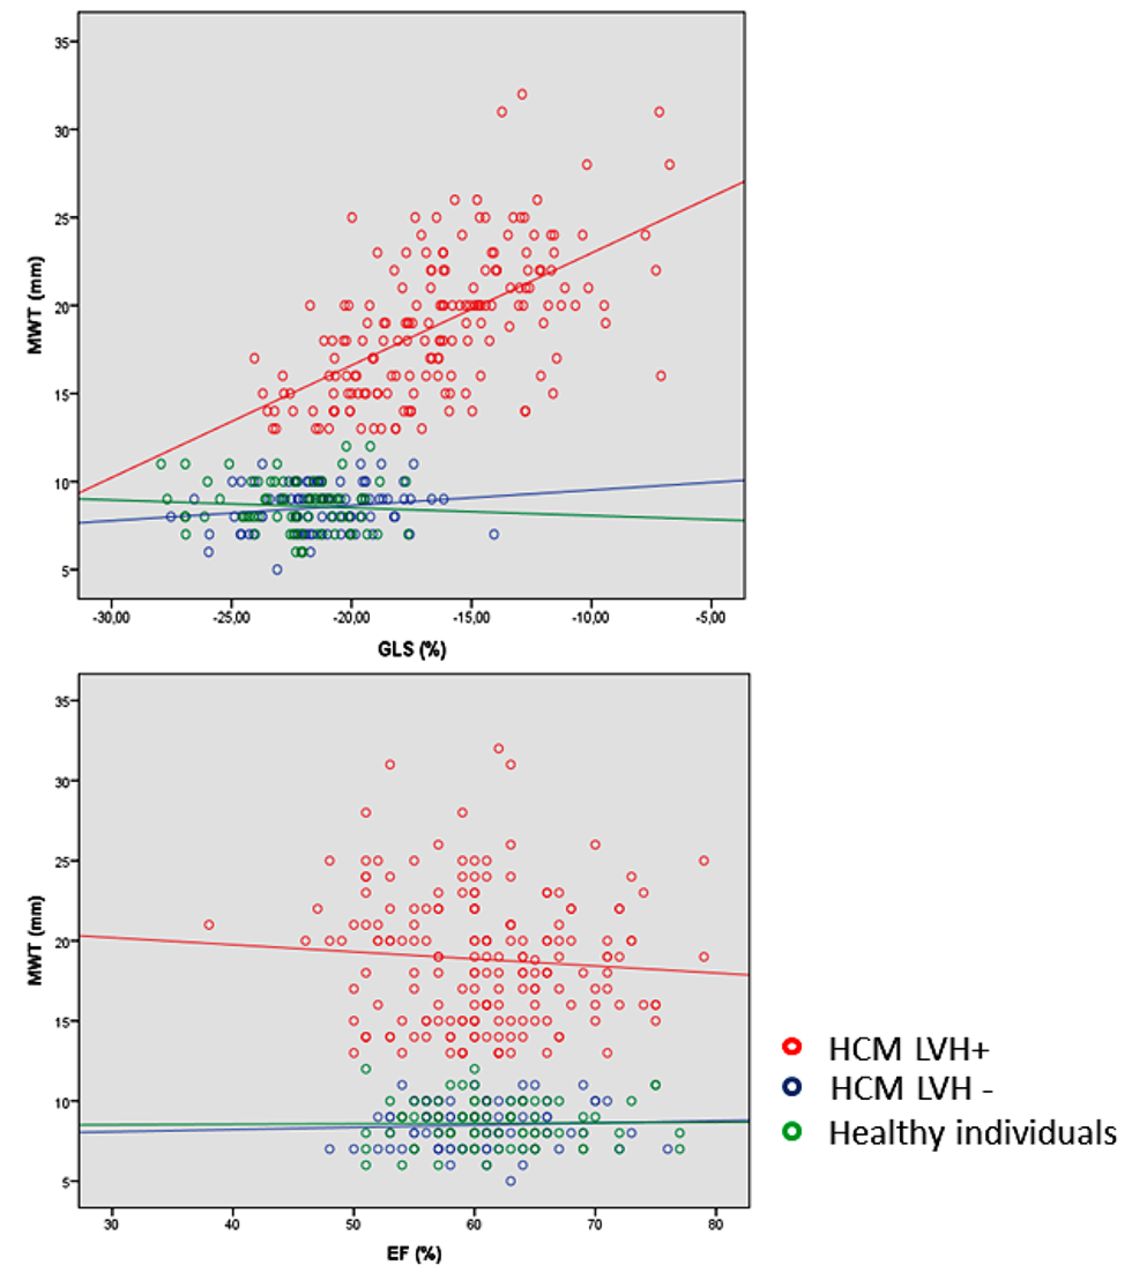
A lower ESVI was closely related to EF in HCM LVH+ and HCM LVH− patients (R=0.45, p<0.001 and R=0.43, p<0.001) as expected, but there was no relationship with GLS (R=0.02, p=0.77 and R=0.11, p=0.31). Increased MWT correlated significantly with worse GLS (R=0.58, p<0.001), but not with EF (R=0.018, p=0.30) in the HCM LVH+ patients. There were no correlation between MWT and GLS or EF in the HCM LVH− patients (R=0.16, p=0.13 and R=0.05, p=0.60) and in the healthy individuals (R=0.07, p=0.53 and R=0.01, p=0.91) (figure 3).
Scatter plot of relationship between MWT, GLS and EF upper panel shows that GLS was closely related to MWT with worse LV function by GLS correlating to increased wall thickness (R=0.58, p<0.001) in the HCM LVH+ patients (red dots), but with no correlation between GLS and MWT (R=0.16, p=0.13) in the HCM LVH− (blue dots) and the healthy individuals (R=0.07, p=0.53) (green dots). Lower panel shows that there was no significant correlation between EF and MWT in the HCM LVH+ patients (R=0.018, p=0.30) or in the HCM LVH− patients and the healthy individuals (R=0.05, p=0.60 and R=0.01, p=0.91). EF, ejection fraction; GLS, global longitudinal strain; HCM LVH+, hypertrophic cardiomyopathy patients with hypertrophy; HCM LVH−, genotype-positive patients without hypertrophy; MWT, maximal wall thickness.
In the HCM LVH+ population, lower EDVI and ESVI were significantly related to lower eʹ (R=0.24, p=0.05 and R=0.21, p=0.01) and lower eʹ was significantly correlated to worse GLS (R=0.47, p<0.001). There was a weak correlation between cardiac volumes and lower eʹ in the HCM LVH− patients (R=0.27, p=0.02 for EDVI and R=0.32, p=0.04 for ESVI, respectively), but with no correlation between eʹ and GLS (R=0.03, p=0.79).
Feasibility and variability analyses
LV volume measurements could be performed in all patients and healthy individuals with intraobserver and interobserver intraclass correlation coefficient of 0.97 (95% CI 0.87 to 0.99) and 0.92 (95% CI 0.69 to 0.98) for EDV and 0.97 (95% CI 0.88 to 0.99) and 0.93 (95% CI 0.72 to 0.98) for ESV, respectively.
Strain analysis could be performed in 176 (98%) HCM LVH+ patients, 89 (89%) HCM LVH− patients and 78 (98%) healthy individuals. Ninety per cent of the LV segments were included in strain analyses in HCM LVH+ and HCM LVH− patients and 94% of LV segments in healthy individuals. Intraobserver and interobserver intraclass correlation coefficients were 0.90 (95% CI 0.61 to 0.98) and 0.91 (95% CI 0.72 to 0.97), respectively, for strain measurements.
Discussion
Our study demonstrated a close relationship between volume changes and EF in patients with HCM, whereas GLS was related to MWT. Volumetric changes and reduced diastolic and systolic function were present also in HCM LVH− patients with smaller cardiac volumes, reduced eʹ and worse GLS compared with healthy individuals despite normal cardiac wall thickness, indicating a continuum of volumetric and systolic changes from the healthy individuals to HCM LVH− and HCM LVH+ patients.
The chain of mechanisms in HCM disease is complex and is influenced by several molecular changes and haemodynamic alterations. Our results imply that the initial changes in HCM are characterised by a gradually less compliant and stiffer LV which contributes to the decreased systolic long axis function and diastolic dysfunction before the occurrence of visible morphological changes. As HCM disease progresses, the continued increase in wall thickness and reduced cavity will further aggravate LV long axis dysfunction and prevent normal LV filling, whereas the reduced cavity size will lead to normal values of EF.
Volume and myocardial compliance
This study demonstrated reduced LV volumes in HCM LVH+ patients compared with HCM LVH− patients and healthy individuals in line with previous studies.20 The reduced LV volumes may have several explanations. Increased MWT will lead to decreased size of the heart cavity, both in systole and in diastole. However, the decreased volume cannot be attributed to the increase in MWT alone. As expected, diastolic function was reduced in our HCM LVH+ patients compared with HCM LVH− patients and healthy individuals. Diastolic dysfunction was significantly related to cardiac volumes with a significant correlation between lower eʹ and lower cardiac volumes confirming the relationship between decreased LV filling and reductions in cardiac volumes in HCM LVH+.12
Our results showed reduced LV volumes also in the HCM LVH− patients with normal wall thickness. Captur et al showed reduced ESV in HCM LVH− patients by cardiovascular magnetic resonance (CMR) supporting our findings.21 The mechanisms for reduced volumes in HCM LVH− are less clear. We know that reduced ventricular compliance will move the Frank-Starling pressure–volume curve leftward and the end-diastolic pressure and preload become higher despite smaller EDV.22 HCM LVH− patient had reduced eʹ compared with healthy individuals, and we speculate if higher LV end-diastolic pressures and decreased LV filling may be a possible explanation for the reduced diastolic and systolic volumes even in this early stage of disease.23 Despite changes in LV volume and eʹ, there were no significant differences in diastolic parameters as deceleration time, E/ eʹ and left atrium area between healthy individuals and HCM LVH− patients. However, the diastolic variances can be underestimated because of the significant age difference with younger HCM LVH− patients. This is a limitation in our study.
Myocardial function and wall thickness
Not surprisingly, EF was similar in both HCM groups compared with healthy individuals despite severely reduced systolic function by GLS in our HCM LVH+ patients. The preserved EF in the HCM LVH+ could be explained by the smaller volumes in HCM, which directly influence on the EF equation. Afterload is a major determinant of systolic performance, and according to Laplace law, directly related to LV systolic pressure and radius and inversely related to wall thickness as typically found in hypertension and in aortic stenosis maintaining normal EF.24 However, in HCM LVH+ patients, the hypertrophy is the pathophysiological cause of the disease and the reduction in afterload due to ventricular wall changes cannot be directly attributed to changes in systolic function found in our patients.25 We believe that reduced systolic function by GLS in the HCM LVH+ patients may be explained by reduced LV compliance and myocardial fibrosis. It has previously been shown that diastolic and longitudinal systolic LV function by GLS is more depressed in HCM LVH+ patients with fibrosis by CMR.5 7 26 27
The distribution of hypertrophy according to Maron classification in our HCM LVH+ population with worse GLS in type III phenotype is in line with previous publication by Reant et al.17 Worse LV function by GLS was closely related to increased MWT, whereas EF was not related to MWT in our study. Increased wall thickness is a good indicator of the staging of disease, and our results suggest that GLS is a sensitive parameter for detecting systolic impairment related to increased wall thickness, in contrast to EF. GLS should therefore be evaluated at every visit in patients with HCM .
GLS was reduced in the HCM LVH− compared with the healthy individuals. Cardim et al have showed that myocardial longitudinal velocities and deformation parameters may be abnormal before the development of increased wall thickness and to be a hallmark in HCM LVH− patients.11 Our results with the subtle changes in cardiac volumes, reduced eʹ and worse GLS compared with healthy individuals confirm the occurrence of myocardial dysfunction in HCM LVH−. The hypertrophy can therefore be a compensatory mechanism for the mutation induced abnormalities.28 29
We speculate if interstitial fibrosis can contribute to deteriorated GLS, diastolic dysfunction and smaller cardiac volumes in our HCM LVH− patients compared with healthy individuals. Our study could not address the impact of myocardial fibrosis assessed by CMR on myocardial function, however, studies on precontrast and postcontrast myocardial relaxation time (T1) mapping by CMR have demonstrated increased interstitial fibrosis independent of LV hypertrophy. Interstitial fibrosis may therefore be an early consequence of sarcomere mutations, and not only a downstream response to LV hypertrophy.30 Although cardiac volumes were significantly smaller and GLS worse in HCM LVH− compared with healthy individuals, measurements were within normal ranges, which makes GLS difficult to use as a parameter to distinguish them from the healthy individuals.
Clinical implications
Future studies should investigate if HCM LVH− patients with the smallest cardiac volumes and with worse GLS are more likely to develop a HCM LVH+ phenotype with increased wall thickness later in life. We are in need of longitudinal follow-up data to confirm our findings, but we suggest that HCM LVH− with volumetric and subtle diastolic and systolic dysfunction should be followed as closely as the HCM LVH+ patients according to the guidelines.1
Study limitations
Volume and strain measurements are dependent on good image quality as all echocardiographic measurements. The use of 2-D echocardiography to calculate LV volumes in HCM patients with increased MWT and asymmetry of the LV chamber is challenging and is a limitation of our findings. In addition, it can be challenging to fit the region of interest for strain analyses correctly in HCM patients due to variable wall thickness. In our population, gender and age were unequally distributed between groups, with a male to female ratio of 1.4:1 and higher age in the HCM LVH+ population. This is in line with previous reports, showing higher penetrance of HCM phenotype in males with increasing age.31
Conclusion
The preserved EF was related to smaller cardiac volumes in HCM LVH+ patients. Worse GLS by strain echocardiography correlated with increased MWT and is therefore a good parameter staging the HCM disease. HCM LVH− patients had subtle changes with reduced cardiac volumes and systolic function compared with healthy individuals, indicating a continuum of volumetric and systolic changes before wall thickness increases above normal.
Acknowledgments
We thank all the individuals who participated in this study.
References
Footnotes
Contributors All authors have read and approved the manuscript.
Funding This work was supported by the Center for Cardiological Innovation, funded by the Research Council of Norway.
Competing interests None declared.
Ethics approval The study complied with the Declaration of Helsinki and was approved by the Regional Committees for Medical Research Ethics.
Provenance and peer review Not commissioned; externally peer reviewed.
Data sharing statement No available unpublished data.