Article Text

Abstract
Aims The four most promising semiautomated techniques (5-SD, 6-SD, Otsu and the full width half maximum (FWHM)) were compared in paired acute and follow-up cardiovascular magnetic resonance (CMR), taking into account the impact of microvascular obstruction (MVO) and using automated extracellular volume fraction (ECV) maps for reference. Furthermore, their performances on the acute scan were compared against manual myocardial infarct (MI) size to predict adverse left ventricular (LV) remodelling (≥20% increase in end-diastolic volume).
Methods 40 patients with reperfused ST segment elevation myocardial infarction (STEMI) with a paired acute (4±2 days) and follow-up CMR scan (5±2 months) were recruited prospectively. All CMR analysis was performed on CVI42.
Results Using manual MI size as the reference standard, 6-SD accurately quantified acute (24.9±14.0%LV, p=0.81, no bias) and chronic MI size (17.2±9.7%LV, p=0.88, no bias). The performance of FWHM for acute MI size was affected by the acquisition sequence used. Furthermore, FWHM underestimated chronic MI size in those with previous MVO due to the significantly higher ECV in the MI core on the follow-up scans previously occupied by MVO (82 (75–88)% vs 62 (51–68)%, p<0.001). 5-SD and Otsu were precise but overestimated acute and chronic MI size. All techniques were performed with high diagnostic accuracy and equally well to predict adverse LV remodelling.
Conclusions 6-SD was the most accurate for acute and chronic MI size and should be the preferred semiautomatic technique in randomised controlled trials. However, 5-SD, FWHM and Otsu could also be used when precise MI size quantification may be adequate (eg, observational studies).
- Infarct size
- Myocardial infarction
- Microvascular obstruction
- extracellular volume fraction
- cardiovascular magnetic resonance
This is an Open Access article distributed in accordance with the Creative Commons Attribution Non Commercial (CC BY-NC 4.0) license, which permits others to distribute, remix, adapt, build upon this work non-commercially, and license their derivative works on different terms, provided the original work is properly cited and the use is non-commercial. See: http://creativecommons.org/licenses/by-nc/4.0/
Statistics from Altmetric.com
- Infarct size
- Myocardial infarction
- Microvascular obstruction
- extracellular volume fraction
- cardiovascular magnetic resonance
Key questions
What is already known about this subject?
Manual delineation of myocardial infarct (MI) size is considered the gold standard. However, this can be subjective and time-consuming. The current recommendation for measuring MI size by cardiovascular magnetic resonance is using the 5-SD technique to improve reproducibility.
What does this study add?
Six-SD is the optimal technique to quantify acute and follow-up MI size and should be the semiautomated technique of choice in situations when accurate MI size quantification is required (eg, randomised controlled trials).
However, the other three promising techniques (5-SD, Otsu, FWHM) are all equally precise and performed equally well to predict adverse left ventricular remodelling. Therefore, they can all be used in the context of registries or observational studies for MI size quantification.
How might this impact on clinical practice?
This study would contribute to changing the current recommendations on MI size quantification.
Furthermore, this study would guide other research groups to choose the optimal semiautomated method for MI size, depending on the research context.
Introduction
In patients presenting with an acute ST segment elevation myocardial infarction (STEMI), acute and chronic myocardial infarct (MI) sizes have been shown to be strong predictors of adverse left ventricular (LV) remodelling1 ,2 and mortality.3 ,4 The gold standard reference for assessing MI size is by late gadolinium enhancement (LGE) cardiovascular magnetic resonance (CMR), and can be performed in the first week following STEMI and repeated after several months.5 ,6
However, there is currently no established gold standard technique for quantifying MI size using LGE CMR. Several different techniques have been proposed for quantifying MI size including manual contouring7 and semiautomated thresholding techniques such as a signal intensity threshold of 5-SD8 or 6-SD9 above the normal remote myocardium, the Otsu technique,10 and the full width half maximum (FWHM)11 ,12 technique. The consensus document from the Society for Cardiovascular Magnetic Resonance Board of Trustees Task Force on Standardised Post Processing recommends the semiautomated threshold technique of 5-SD for MI size quantification as it may improve reproducibility. Manual contouring is considered the gold standard7 ,13 but may be time-consuming12 ,14 and subjective. FWHM has emerged as the technique having the lowest variability11 ,12 but others have shown FWHM to underestimate acute and chronic MI size.10 ,15 Recently FWHM45% and 6-SD were found to perform well in paired acute and follow-up scans at 3 T.15
By convention, the FWHM technique16 uses a threshold of above 50% of the maximal signal intensity of the reference region of interest (ROI) as the cut-off threshold and we hypothesised that areas previously occupied by microvascular obstruction (MVO) on the follow-up CMR are likely to affect the highest signal intensity and impact on MI size quantification, compared with those without previous MVO. Therefore, the aim of our study was first to assess the impact of MVO on the performance of four most promising semiautomated techniques (5-SD, 6-SD, Otsu and FWHM) against manual contouring (referred to as Manual contouring throughout the article) as the reference standard7 ,13 in paired acute and follow-up CMR scans at 1.5 T. Second, we aimed to assess their performance on the acute scan to predict the development of adverse LV remodelling (≥20% increase in end-diastolic volume).17
Methods
Study population
Patients included in this study have been included in two recently published studies investigating the role of the remote myocardium in patients developing adverse LV remodelling18 and the role of intramyocardial haemorrhage and residual iron in the development of adverse LV remodelling, respectively.19 In brief, the UK National Research Ethics Service approved this study and 50 STEMI patients were prospectively recruited from August 2013 to July 2014 following informed consent. The study complied with the Declaration of Helsinki. Forty-eight patients completed the first CMR at 4±2 days post-primary percutaneous coronary intervention (PPCI) and 40 patients had a follow-up scan at 5±2 months. The 40 patients with paired acute and follow-up scans were analysed for this study. The patient selection flow chart has been published previously.18 Study exclusion criteria were known previous MI and standard recognised contraindications to CMR (ferromagnetic implants such as non-CMR-conditional pacemakers and implanted cardioverter-defibrillators, ferromagnetic vascular and endocranial clips, foreign metallic bodies to vital organs such as the eye and brain, claustrophobia and estimated glomerular filtration rate <30 mL/min).
Imaging acquisition
All CMR scans were performed on a 1.5 T scanner (Magnetom Avanto, Siemens Medical Solutions) using a 32-channel phased-array cardiac coil. The imaging protocol included whole LV coverage for short-axis cines, LGE and automated extracellular volume fraction (ECV) maps were available (30 patients had whole LV coverage and 10 patients had base, mid and apical short-axis ECV maps) as described in our previous publication.18
Late gadolinium enhancement
LGE imaging was acquired using either a standard segmented ‘fast low-angle shot’ (FLASH) two-dimensional inversion-recovery gradient echo sequence (imaging parameters were: bandwidth 140 Hz/pixel; echo time =3.17 ms; repetition time =700–900 ms; flip angle =21°; acquisition matrix =125×256; slice thickness =8 mm) or a free-breathing, respiratory motion-corrected (FB MOCO) single shot steady state free precession averaged inversion recovery sequence20 (typical imaging parameters were: bandwidth 977 Hz/pixel; echo time =1.48 ms; repetition time =700–900 ms; flip angle =50°; acquisition matrix =144×256; slice thickness =8 mm) between 10–15 min after 0.1 mmol/kg of gadoterate meglumine (Gd-DOTA marketed as Dotarem, Guerbet S.A., Paris, France). For both LGE sequences, the inversion times were optimised to null the normal remote myocardium (typical values 360–440 ms).
The acquisition protocols for the native and postcontrast MOLLI T1 maps and the method used to generate the automated ECV maps have been described in detail in our recent publication.18
Imaging analysis
All imaging analysis was performed using CVI42 software (V.5.1.2 (303), Calgary, Canada).
Adverse LV remodelling was defined as a ≥20% increase in end-diastolic volume at follow-up when compared with the acute scan.17
MI quantification
The endocardial and epicardial borders were manually drawn on all the LGE images. MI size was quantified using Manual contouring by an experienced operator (HB—2.5 years of experience in STEMI CMR scans analysis) and expressed as the percentage of the whole LV (%LV). Areas of hypointense core of MVO (late MVO—defined as patients with a hypointense core in the areas of the hyperenhancement on the LGE images performed between 10 and 15 min) were included as part of the MI zone. Minimal adjustments were also performed if artefacts were present in the remote myocardium and these artefacts were manually excluded.
Thresholds of 5-SD, 6-SD, Otsu and FWHM were applied on these LGE images with predrawn endocardial and epicardial borders to obtain corresponding MI sizes and expressed as %LV.
For 5-SD and 6-SD (to identify signal intensities of 5-SD and 6-SD above the mean normal remote myocardium, respectively), an ROI was identified in the normal remote myocardium on every slice using the automatic option from CVI42, with minimal manual adjustment when required to minimise intraobserver variability.
Twenty scans (10 acute and 10 follow-up) were randomly selected for interobserver and intraobserver variability for MI size quantification by Manual contouring. Furthermore, the reproducibility of MI size by 5-SD and 6-SD when using manually drawn remote myocardial ROI and automatic remote myocardial ROI detection with minimal manual adjustment as illustrated in figure 1 were compared.

Illustration of the steps used in the quantification of MI size. Endocardial and epicardial borders were first manually drawn (A, B). (C) Illustrates the manual ROI delineation in the remote normal myocardium and Manual contouring of the MI (red arrows). (D) Illustrates the automated ROI delineation. As shown by the red arrows in (D), in this case, the ROIs need minimal manual adjustment (as shown in (E) by the red arrows) to make sure it was not in a segment containing LGE. Areas of MVO appear as a hypointense areas (red arrow in (F)) and needed manual correction (red arrow in (G)) to include it as part of the MI. LGE, late gadolinium enhancement; MI, myocardial infarct; MVO, microvascular obstruction; ROI, region of interest.
For the FWHM technique (to identify signal intensities that are above 50% of maximal signal intensity of the reference ROI),16 the automatic option was also used to delineate an ROI in the area enhancement by LGE on every slice.
The Otsu technique (to identify the intensity threshold from the signal intensity histogram using the value with minimal intraclass variance between low and high intensities)21 did not require any additional ROIs as reference but did require user input to identify slices with no LGE as normal.
Automated ECV maps
Manual ROI were drawn in the core of the MI zone (corresponding to areas of MVO in some patients with a hypointense core on the acute scan LGE) on the acute and matching ROIs were copied to the follow-up maps to obtain representative ECV values.
Statistical analysis
SPSS V.22 (IBM Corporation, Illinois, USA) was used for the majority of the statistical analyses and MedCalc for Windows V.15.6.1 (MedCalc Software, Ostend, Belgium) was used for receiver operating characteristic (ROC) comparison using the technique described by Delong et al.22 Normality was assessed using Shapiro-Wilk test. Continuous data were expressed as mean±SD or median (IQR). Groups were compared using paired Student's t-test/Wilcoxon signed rank test or unpaired Student's t-test/Mann-Whitney U test where appropriate. Categorical data were reported as frequencies and percentages.
Coefficient of variability (CoV) was assessed by dividing the SD of the differences between the two methods by the mean.
Intraobserver and interobserver reproducibility for Manual contouring was assessed in 20 scans using intraclass correlation coefficient (ICC) with 95% CIs, CoV and Bland-Altman analysis (expressed as bias ±2 SD for limits of agreement). For 5-SD and 6-SD, intraobserver reproducibility was performed for using manual remote myocardial ROI delineation versus automatic remote myocardial ROI detection in the same 20 scans.
Intermethod precision and accuracy for MI size quantification was assessed as defined below:
Precision: A semiautomatic technique was considered precise when the intermethod CoV was <10% and the ICC was >0.900 (arbitrary cut-offs to denote good precision in the absence of a reference standard).
Accuracy: A semiautomatic technique was considered accurate when compared with Manual contouring if there was no statistically significant difference between them on paired tests and no bias was present on Bland-Altman analysis.
ROC analyses were performed to assess the diagnostic performance for MI size by Manual contouring, 5-SD, 6-SD, Otsu and FWHM on the acute scan to predict adverse LV remodelling.
All statistical tests were two-tailed, and p<0.05 was considered statistically significant.
Results
The mean age of the patients with STEMI was 59±13 years and 88% were men. Further details regarding the patients’ clinical, angiographic and CMR characteristics are listed in table 1. The mean acute MI size was 25.0±13.7%LV (Manual contouring). The mean left ventricular ejection fraction (LVEF) on the acute scan was 49±8% and at follow-up was 53±10%. As expected, there was a significant regression in MI size between the acute scan and the follow-up scan (25.0±13.7%LV vs 17.3±10.1%LV, p<0.001, percentage of MI regression: 32±20%). Of the 40 patients, 26 (65%) had MVO on the acute scan. Figure 2 illustrates an example of MI size quantification by the five semiautomated techniques in a paired acute and follow-up LGE short-axis slice.
Clinical, angiographic and CMR characteristics of the patients with STEMI

Acute and follow-up MI size quantification by different techniques. This is an example of a paired acute (3 days) and follow-up (6 months) short-axis LGE of a patient with an anterior STEMI reperfused by PPCI. This example highlights the presence of MVO on the acute scan (orange highlighted areas) and subsequent underestimation of MI size by FWHM on the follow-up scan. FWHM, full width half maximum; LGE, late gadolinium enhancement; MI, myocardial infarct; MVO, microvascular obstruction; STEMI, ST segment elevation myocardial infarction; PPCI, primary percutaneous coronary intervention.
Intraobserver and interobserver variability
There was excellent intraobserver (ICC of 0.996 (0.988 to 0.998; CoV: 4.3%; bias: 0.5±2.2%LV, p=0.07) and interobserver (ICC of 0.987 (0.968 to 0.995); CoV: 8.2%; bias: 0.5±4.2%LV, p=0.35) reproducibility for Manual contouring.
There was also better intraobserver reproducibility for MI size quantification by the SD technique when automatic remote myocardial ROI delineation was used compared with manual drawing of remote myocardial ROI with a narrower 95% CI for the ICC and narrower limits of agreement on Bland-Altman analysis (manual remote ROI: ICC of 0.990 (0.981 to 0.995): CoV: 7%; bias: 0.1±3.9%LV, p=0.09; automatic remote ROI: ICC of 0.999 (0.998 to 0.999); CoV: 2.3%; bias: 0.2±1.2%LV, p=0.87).
Acute MI size quantification
Six-SD (CoV: 5.1%; ICC: 0.982 (0.966 to 0.991); MI size: 24.9±14.0%LV, p=0.81; bias: 0.1±5.2%LV) and FWHM (CoV: 6.4%; ICC: 0.970 (0.943 to 0.984); MI size: 24.1±13.1%LV, p=0.066; bias: 1.0±6.2%LV) precisely and accurately quantified acute MI size when compared with Manual contouring (25.0±13.7%LV). In contrast, 5-SD (CoV: 6.8%; ICC: 0.971 (0.811 to 0.990); MI size: 27.4±14.6%LV, p<0.0001; bias: −2.4±5.0%LV) and Otsu (CoV: 8.4%; ICC: 0.953 (0.441 to 0.987); MI size: 28.4±13.9%LV, p<0.0001; bias: −3.4±5.2%LV) were precise but not accurate as they both overestimated acute MI size (figure 3).

Comparison of acute and follow-up MI size quantification by different techniques. On the acute scan (red bars), MI size by FWHM and 6-SD was similar to Manual whereas on the follow-up scan (blue bars), FWHM underestimated MI size and 6-SD remained similar to Manual. On the acute and follow-up scans, 5-SD and Otsu overestimated MI size. *Denotes statistically significant difference. FWHM, full width half maximum; MI, myocardial infarct.
Chronic MI size quantification
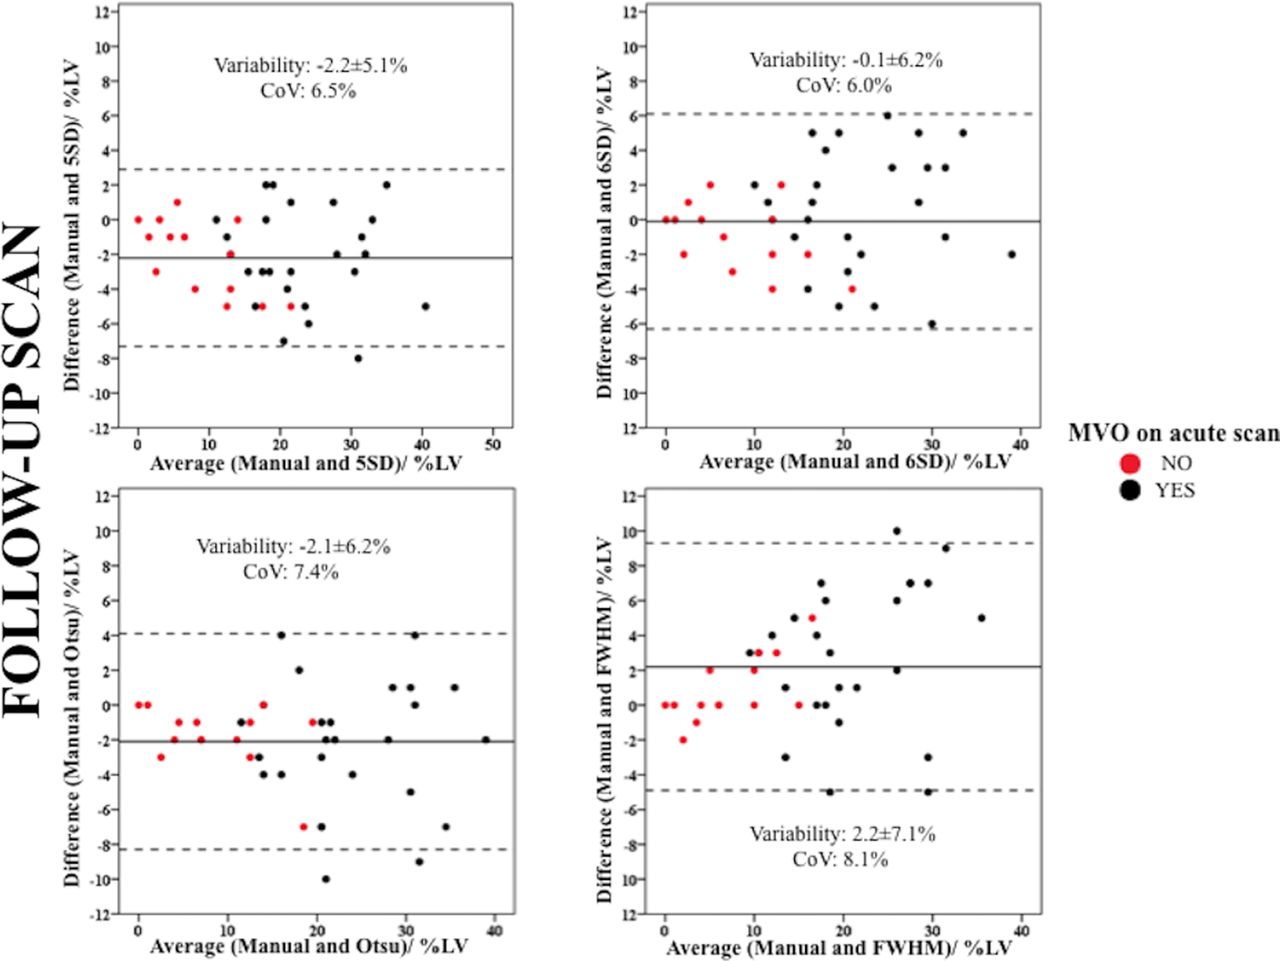
Only 6-SD (CoV: 6.0%; ICC: 0.952 (0.911 to 0.974); MI size: 17.2±9.7%LV, p=0.88; bias: −0.1±6.2%LV) precisely and accurately delineated chronic MI size when compared with Manual (17.3±10.1%LV). As on the acute scan, 5-SD (CoV: 6.5%; ICC: 0.949 (0.752 to 0.982); MI size: 19.5±10.4%LV, p<0.0001; bias: −2.2±5.1%LV) and Otsu (CoV: 7.4%; ICC: 0.934 (0.788 to 0.973); MI size: 19.5±10.4%LV, p<0.001; bias −2.1±6.2%LV) were precise but not accurate as they overestimated chronic MI size. On the other hand, FWHM (CoV: 8.1%; ICC: 0.910 (0.755 to 0.957); MI size: 15.1±8.7%LV, p<0.001; bias: 2.2±7.1%LV) was precise but not accurate as it underestimated chronic MI size (figure 3).
Impact of MVO on MI size quantification
All patients with MVO (26/40) had complete resolution of the dark core on the LGE images on the follow-up scan. The percentage of MI size regression was significantly greater for those without MVO (with MVO: 27±17%, without MVO: 42±22%, p=0.028). As was the case for the whole cohort, there was no significant difference between FWHM, Manual contouring and 6-SD for those with and without MVO, and 5-SD and Otsu overestimated acute MI size.
On the follow-up scan, FWHM remained similar to Manual contouring for those without previous MVO but underestimated chronic MI size only for those with previous MVO. The three other techniques maintained their previous relationship for those with and without previous MVO: 6-SD was similar to Manual contouring but 5-SD and Otsu were significantly higher than Manual contouring. Further details for the comparison of MI size in those with and without MVO are available in table 2 and the Bland-Altman plots in figure 4.
MI size quantification in patients with and without MVO
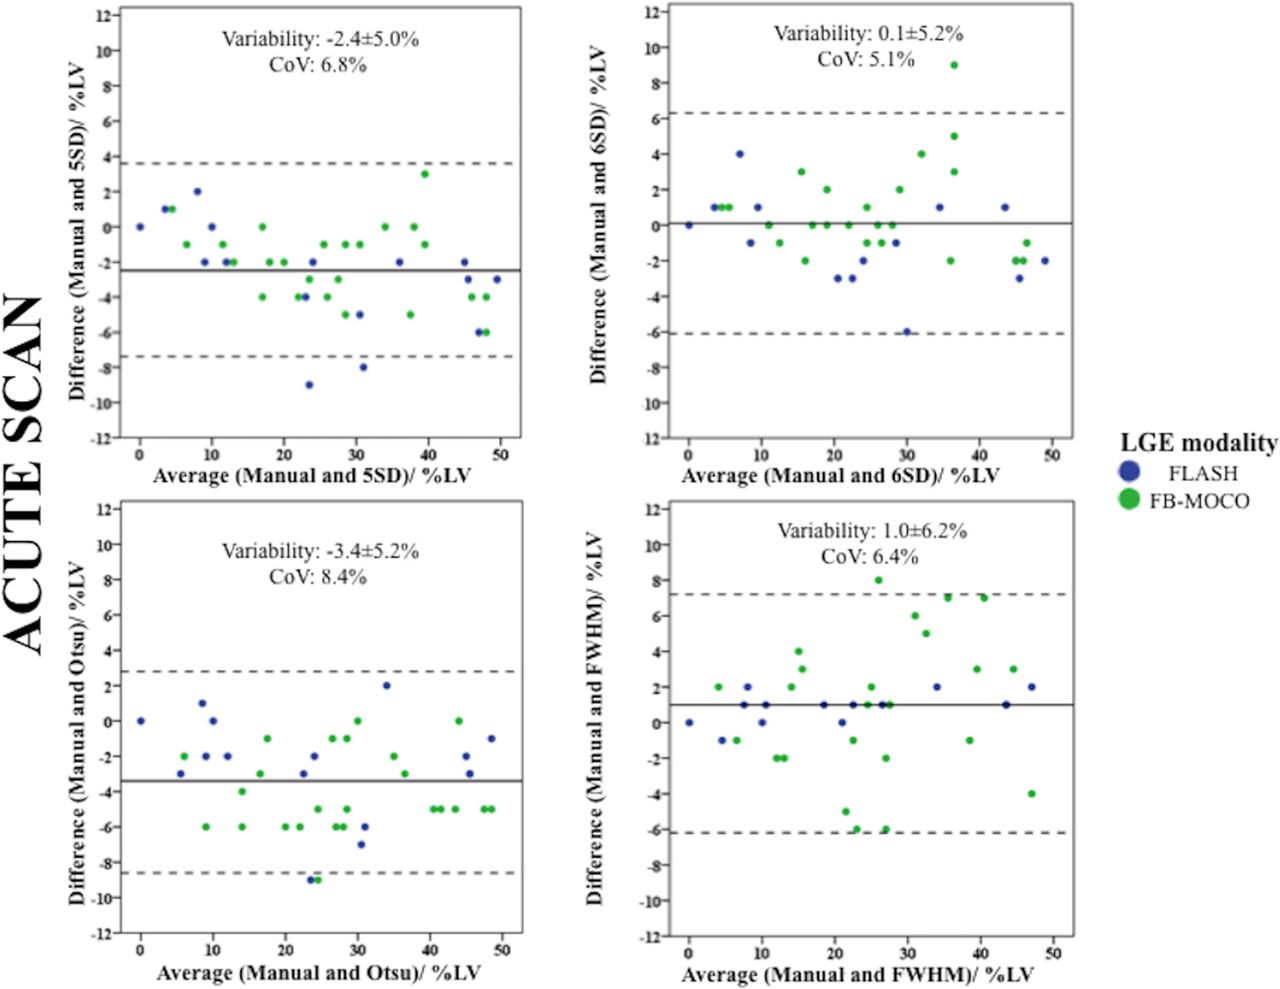
Bland-Altman plots of the acute MI size using the four semiautomated methods against Manual and differentiated by the LGE sequence used. The blue dots represent patients with FLASH LGE sequence and the green dots represent patients with FB MOCO LGE sequence. There was no bias between 6-SD and Manual and FWHM and Manual and all CoV were within acceptable limits. However, compared with Manual, FWHM was dependent of the LGE sequence used. Five-SD and Otsu overestimated acute MI size. CoV, coefficient of variability; FB MOCO LGE, free breathing and motion corrected late gadolinium enhancement; FLASH LGE, fast low-angle shot late gadolinium enhancement; FWHM, full width half maximum; LGE, late gadolinium enhancement; MI, myocardial infarct.
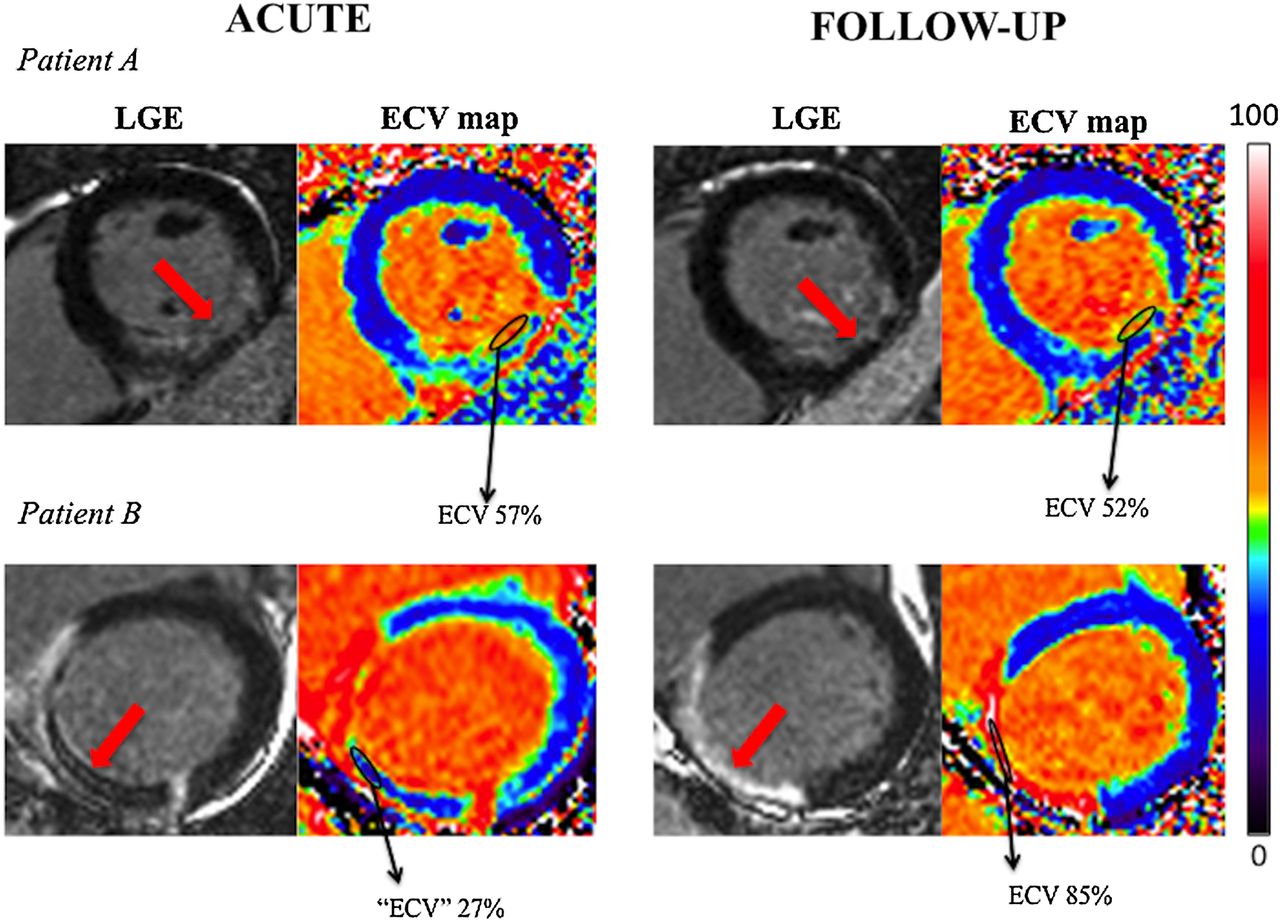
On the acute scan, the median ECV in the infarct core was 59 (40–72)% in those without MVO and was significantly higher than those with MVO (34 (28–40)%, p=0.02). On the other hand, at follow-up, the median ECV in those with MVO on the acute scan was significantly higher than those without previous MVO. Figure 5 shows an example of two patients with paired acute and follow-up LGE and corresponding ECV map (Patient A had no MVO on the acute scan and Patient B had a large area of MVO. The corresponding area of MVO on the follow-up scan had a very high ECV of 85%).

Paired LGE and automated ECV maps of two patients with and without MVO. Both patients presented with an inferior STEMI (red arrows). Patient A had no MVO on the acute scan and Patient B had a large area of MVO. The corresponding area of MVO on the follow-up scan had a very high ECV of 85% for Patient A compared with an ECV of 52 for Patient B. ECV, extracellular volume fraction; LGE, late gadolinium enhancement; MVO, microvascular obstruction; STEMI; ST segment elevation myocardial infarction.
Influence of LGE sequence choice on MI size quantification
The quantification methods were also compared for each subset of the LGE sequences (FLASH: n=24; FB MOCO: n=16). As for the whole cohort, 5-SD and Otsu were significantly higher than Manual and 6-SD were, similar to Manual contouring for both LGE sequences on the acute and follow-up scans. FWHM was significantly lower than Manual contouring for both LGE sequences on the follow-up scans. However, on the acute scans, FWHM was similar to Manual for FLASH but significantly lower for the FB MOCO sequence (FB MOCO: Manual: 23.4±15.9%LV vs FWHM: 22.6±15.5%LV, p=0.001). Further details are shown in table 3 and the Bland-Altman plots in figure 6. Of note, the incidence of MVO was similar in each group (FB MOCO 63%, FLASH 67%, p=0.52) and therefore this difference in MI size for FB-MOCO seen was unlikely confounded by MVO.
MI size quantification using different LGE sequences

Bland-Altman plots of the chronic MI size using the four semiautomated methods against Manual and differentiated by the previous MVO or no MVO on the acute scan. The black dots represent patients with MVO on the acute scan and the red dots represent patients with no MVO on the acute scan. There was no bias between 6-SD and Manual and all CoV were within acceptable limits. FWHM underestimated chronic MI size, especially in those with previous MVO. 5-SD and Otsu overestimated chronic MI size. CoV, coefficient of variability; FWHM, full width half maximum; MI, myocardial infarct; MVO, microvascular obstruction.
Acute MI size quantification and adverse LV remodelling
Of the 40 patients, 8 (20%) developed adverse LV remodelling. The diagnostic performances of Manual contouring, 5-SD, 6-SD, Otsu and FWHM were all very high with all five areas under the curve of ≥0.90 as shown in table 4 and figure 7. ROC curve comparisons showed no significant differences between them (Manual contouring vs: 5-SD, p=0.14; 6-SD, p=1.0; Otsu, p=0.14; FWHM, p=0.56). The sensitivities and specificities and cut-off values for acute MI size to predict adverse LV remodelling by the different techniques are listed in table 4.
Performance of the five techniques for quantifying acute MI size on predicting adverse LV remodelling at follow-up

ROC curves for acute MI size by five techniques to predict adverse LV remodelling. This is the ROC curves comparison to assess the diagnostic performance of the five quantification techniques to predict an adverse LV remodelling. LV, left ventricular; MI, myocardial infarct; ROC, receiver operating characteristic.
Acute MI size and LVEF
Acute MI size analysed by all four semiautomated techniques correlated equally well with acute LVEF (Pearson's correlation coefficients of −0.58 for 5-SD, −0.57 for 6-SD, −0.61 for Otsu and −0.58 for FWHM) and LVEF at 5 months (with the same Pearson's correlation coefficients of −0.67 for all four techniques).
Discussion
The main findings from this study are as follows: (1) the 6-SD technique was as accurate as Manual for acute and chronic MI size quantification; (2) FWHM performed as well as Manual for acute MI size quantification by FLASH LGE sequence and was significantly lower than Manual by FB MOCO LGE sequence; (3) FWHM underestimated chronic MI size and this predominantly occurred in patients with MVO on the acute scan; (4) 5-SD and Otsu consistently overestimated acute and chronic MI size when compared with Manual contouring; and (5) All four semiautomated techniques were precise (all with acceptable CoV and excellent intermethod agreement), and on the acute scan, they all performed equally well to predict the development of adverse LV remodelling and correlated equally well with LVEF at follow-up.
Since the introduction of PPCI, mortality due to acute STEMI has declined over the past 2 decades,23 and 1-year mortality has reached a plateau at around 11%.24 However, despite a decline in mortality, morbidity post MI remains significant.25–29 Morbidity and mortality post STEMI is closely related to the final MI size. Recently, a meta-analysis of 2632 patients showed that for every 5% increase in MI size, there was a 20% increase in the relative hazard for all-cause death and heart failure hospitalisation at 1 year.30 In a separate meta-analysis of 1025 patients, the presence of MVO was found to be an independent predictor of major adverse cardiovascular events but MI size together with MVO provided incremental prognostic information and those with MI size ≥25% and with MVO had worse outcomes.31 Therefore to further improve outcomes in these patients, MI size by CMR is increasingly being used as a robust surrogate marker in studies assessing the effectiveness of cardioprotective therapies (such as remote ischaemic conditioning,32 metoprolol33 and exenatide34). Although LGE by CMR is considered the gold standard for MI size quantification,5 ,6 ,13 there is currently no established semiautomated technique for its quantification and our study provides several important insights on this topic. First, 6-SD is the most suitable semiautomated technique in studies where accurate quantification of acute MI size is important (eg, randomised controlled trials assessing the effectiveness of cardioprotective therapies on reducing acute and chronic MI size), as it performed as well as Manual contouring. Second, the performance of FWHM against Manual is influenced by the presence of MVO and in studies requiring an accurate quantification of chronic MI size as an end point (eg, randomised controlled trials assessing cardioprotective therapies on reducing MI size at 3–6 months), 6-SD would be preferred to FWHM given that the latter appeared to underestimate chronic MI size especially in patients who had MVO on the acute scan. Third, for those clinical studies only requiring precise (good agreement but with some residual bias) MI size quantification, such as registries or prospective observational studies, and for those aiming to assess other surrogate markers such as LVEF or adverse LV remodelling, any of these four semiautomatic techniques may be acceptable for quantifying MI size.
As part of a previous study looking at the role of the remote myocardial ECV in patients developing adverse LV remodelling,18 we noted that those with MVO on the acute scan displayed an area of high ECV in the infarct core at follow-up. We therefore hypothesised that areas on the follow-up CMR previously occupied by MVO would likely affect the highest signal intensity and impact on MI size quantification, compared with those without previous MVO when using the FWHM technique. This study confirmed that FWHM underestimated chronic MI size and this was due to the very high signal intensities on the follow-up LGE images in the location previously occupied by MVO on the acute LGE images, which after being resorbed, was left with a relatively large interstitial space. These findings were confirmed by the very high ECV of the MI core on the follow-up scan in those with previous MVO. As the FWHM uses the signal intensities that are above 50% of the maximal signal intensity within the scar, some of the scar tissues with ‘intermediate’ signal intensities were classified as having signal intensities within ‘normal’ range in these patients, resulting in an underestimation of chronic MI size. The ‘ECV’ of the MVO on the acute scan was low but this was a reflection of the inability of LGE to penetrate areas of MVO and failure to achieve pseudo-equilibrium rather than a true ECV value for MVO.
FB MOCO has previously been shown to generate similar spatial resolution and contrast to noise ratio in the chronic MI setting.35 Furthermore, a large study, comparing scars from different aetiologies in 390 patients, showed that the LGE size was similar using both LGE techniques, analysed by FWHM.36 However, they did not specifically looked at the group with acute MI. The reason for FWHM to generate a smaller acute MI size than Manual contouring with FB MOCO in our study is not clear but may be due to a difference in contrast to noise ratio between the acute infarct zone and the peri-infarct zone in the acute setting. Unfortunately, we did not acquire paired FB MOCO and FLASH LGE on the same patients for comparison in the acute setting and this warrants further investigation in larger studies.
Several studies have investigated the optimal technique for MI size quantification and these are summarised in table 5. Manual contouring is considered the reference standard7 ,13 because in experienced hands, it has been shown to be more reproducible7 and does not require an ROI in the remote myocardium (required for the SD technique) or in the hyperenhanced area (required for FWHM technique). Therefore, any artefacts in the remote myocardium will not interfere with the Manual contouring method and no additional adjustments are required when MVO is present as this area would be manually included as part of the MI size from the outset. However, Manual contouring has been shown to be time-consuming,12 ,14 and in inexperienced hands, may be subjective, especially when areas of grey peri-infarct zone are present.13 A semiautomated technique is highly desirable as this would improve workflow considerably and would be more objective. Although FWHM has consistently been shown to be more reproducible,7 ,10–12 other studies have shown FWHM to underestimate acute and chronic MI size.10 ,15 Recently FWHM45%15 instead was found to be similar to Manual in chronic MI. However, not all specialist software for MI size quantification allows the adjustment of the signal intensity threshold for the FWHM technique.
Studies investigating MI size quantification techniques by CMR
Our study is the first to show that in patients with MVO on the acute scan, FWHM underestimates chronic MI size on the follow-up scan at 5 months and provided some mechanistic insights using automated ECV maps. Beek et al9 previously showed that 6-SD had the highest accuracy to predict segment wall recovery in a cohort of patients with chronic MI with hibernating myocardium. Flett et al11 showed no difference between Manual contouring and 6-SD in their acute and chronic MI cohorts and Dash et al37 in a conference abstract recently showed that 6-SD was the most accurate to quantify MI size in a porcine model when compared with histology. Most recently, Zhang et al15 have also shown that 6-SD was similar to Manual contouring for acute and follow-up MI size at 3 T. However they did not compare Otsu in their study and they did not investigate the impact of MVO. Therefore, our study is the first to assess the performance of the four most promising semiautomated techniques against Manual in paired acute and follow-up scans and our finding that the 6-SD technique being the most robust is consistent with some of the previous studies.9 ,11 ,15 ,37 McAlindon et al7 recently showed that Manual contouring provided the lowest interobserver, intraobserver and interscan variability, but they did not assess 6-SD in their study. However, Khan et al12 recently showed 6-SD to be higher than Manual contouring in acute MI size quantification, but they only included 10 patients and the remote myocardial ROI was manually drawn. We used the automatic option for ROI delineation with minimal user input when required and we showed that the reproducibility of the n-SD technique is improved when using this approach.
Limitations
We only recruited a small number of patients over a 12 months period as our centre (the then Heart Hospital, now merged with Barts Heart Centre) was a low-volume centre for PPCI. However, consecutive patients were screened and selection bias was unlikely. Furthermore, the number of patients included in this study is similar in size to most studies listed in table 5. We only compared four semiautomated techniques against Manual contouring but we specifically chose those techniques with the most promising results so far and that are widely available in most commercial software for MI size quantification. The automated method previously shown to be very promising and accounting for partial volume effect by Heiberg et al38 is only available from one CMR analysis software and we were not able to include it in this study using CVI42. Likewise, 45% FWHM used by Zhang et al15 was not available on CVI42 and we were not able to assess its performance at 1.5 T in our cohort. We did not perform intraobserver and interobserver variability for all techniques as this has already consistently been performed in several previous studies7 ,10–12 ,15 and was not the main focus of our study. We used Manual contouring as the reference standard7 given that histological validation was not possible in this study and we showed excellent interobserver and intraobserver variability. We did not analyse the impact of early MVO on the quantification method but the majority of our patients with early MVO also had late MVO (26/31, 84%) and the results would very likely be the similar. The number of patients with early MVO only was small and we did not analyse this group separately. We only assessed the performance of acute MI size on the development of adverse LV remodelling. However, other CMR factors such as MVO31 and intramyocardial hemorrhage39 have also been linked to the development of LV remodelling and these were not assessed in this study. We only analysed CMR performed at one magnetic field strength by one vendor and further studies are needed to assess whether our findings are applicable to other vendors and at 3 T. We did not report on clinical outcomes due to our small sample size. The performance of these different semiautomated techniques on clinical outcomes warrants further evaluation in larger studies.
Conclusions
Six-SD was the most accurate for acute and chronic MI size and should be the preferred semiautomatic technique in randomised controlled trials. Five-SD, Otsu and FWHM were equally precise but 5-SD and Otsu overestimated acute and chronic MI size and FWHM underestimated chronic MI size. However, all four semiautomated techniques performed equally well to predict adverse LV remodelling and correlated equally well with LVEF at follow-up. Therefore, 5-SD, 6-SD, Otsu and FWHM may all be used when precise MI size quantification may be sufficient, for example, in observational studies.
Acknowledgments
We express our gratitude to the staff and patients at the UCLH Heart Hospital and Peter Weale for providing us with the investigational sequences under a research collaboration agreement with Siemens Healthcare.
References
Footnotes
Contributors All authors have contributed to the following four criteria: substantial contributions to the conception or design of the work, or the acquisition, analysis, or interpretation of data for the work; drafting the work or revising it critically for important intellectual content; final approval of the version to be published; and agreement to be accountable for all aspects of the work in ensuring that questions related to the accuracy or integrity of any part of the work are appropriately investigated and resolved.
Funding This work was supported by the British Heart Foundation (FS/10/039/28270), the Rosetrees Trust and the National Institute for Health Research University College London Hospitals Biomedical Research Centre.
Competing interests None declared.
Ethics approval NRES Committee London—Harrow Health Research Authority.
Provenance and peer review Not commissioned; externally peer reviewed.
Data sharing statement No additional data are available.