Article Text

Abstract
Background Hypertension and type 2 diabetes mellitus (T2DM) are important causes of non-ischaemic heart failure (HF). Understanding the pathophysiology of early HF may guide screening. We hypothesised that the underlying physiology differed according to aetiology.
Methods In this cross-sectional study of 521 asymptomatic community-based subjects ≥65 years with ≥1 HF risk factors, 187 participants (36%) had T2DM and hypertension (T2DM+/HTN+), 109 (21%) had T2DM with no hypertension (T2DM+/HTN−) and 72 (14%) had neither T2DM nor hypertension (T2DM−/HTN−). In 153 patients (29%), clinic blood pressure was ≥140/90 mm Hg, defined as active hypertension (T2DM−/HTN+). All underwent a comprehensive echocardiogram, including conventional parameters for systolic and diastolic function as well as global longitudinal strain (GLS), diastolic strain (DS) and DS rate (DSR). A 6 min walk (6MW) test was used to assess functional capacity.
Results GLS in T2DM−/HTN+ group (−18.9±2.7%) was similar to that in T2DM−/HTN− group (−19.4±2.4%) and greater than T2DM+/HTN− (−18.0±2.8%, p=0.005). DS in T2DM−/HTN− (0.47±0.15%) exceeded that in T2DM−/HTN+ (0.43±0.14%) and T2DM+/HTN− (0.43±0.13%). 6MW distance was preserved in T2DM−/HTN+ (482±85 m) and reduced in T2DM+/HTN− (469±93, p<0.001). Those with T2DM and active hypertension had worst GLS, DS, DSR and shortest 6MW distance (p<0.002). In multivariable analysis, GLS was associated with T2DM but neither active hypertension nor a history of hypertension. Diastolic markers and left ventricular (LV) mass were associated with hypertension and T2DM. Thus, patients with HF risk factors show different functional disturbances according to aetiology.
Conclusions Patients with hypertension had relatively less impaired GLS and preserved 6MW distance but more impaired diastolic function.
- HEART FAILURE
This is an Open Access article distributed in accordance with the Creative Commons Attribution Non Commercial (CC BY-NC 4.0) license, which permits others to distribute, remix, adapt, build upon this work non-commercially, and license their derivative works on different terms, provided the original work is properly cited and the use is non-commercial. See: http://creativecommons.org/licenses/by-nc/4.0/
Statistics from Altmetric.com
Key questions
What is already known about this subject?
New imaging techniques may be used to identify the early stages of heart failure (HF). It is unclear as to whether these are interchangeable or should be used in specific circumstances.
What does this study add?
Patients with HF risk factors show different functional disturbances according to aetiology. Patients with hypertension had relatively preserved global longitudinal strain and 6 min walk test distance but more impaired diastolic strain (DS) and DS rate.
How might this impact on clinical practice?
The epidemiology of HF is changing, with hypertension and type 2 diabetes being the main causes of non-ischaemic HF. Early detection and management may help to reduce presentations with overt HF, and a mechanistic understanding of the different aetiologies may help appropriate therapy.
Introduction
The aetiology and pathophysiology of heart failure (HF) is undergoing a transition. With the decline of coronary artery disease (CAD), hypertension and type 2 diabetes mellitus (T2DM) have become the most common aetiologies of incident HF. Among these preclinical individuals with stage A HF,1 the risk of incident HF with hypertension is known to be relatively low than CAD and T2DM;2 the role of hypertension as the leading cause of HF3 reflects its prevalence in the community. In contrast, the risk of incident HF is nearly twice as high in those with T2DM than with hypertension.2 Conventional echocardiographic measures of diastolic dysfunction and myocardial strain analysis have been well studied in T2DM and are early markers of diabetic cardiomyopathy.4–6 Unfortunately, the conventional echocardiographic assessment of diastolic function in hypertension often provides inconsistencies7 which may compromise its use to screen for preclinical HF.
A screening and early treatment process could limit the progression to HF arising from the heavy burden of hypertension and T2DM in the community. However, it is not clear whether strain or conventional diastolic measures would be optimal for this purpose, whether they are analogous, or indeed if the underlying ethology has a differential effect on either marker. An understanding of the pathophysiological differences of different causes of preclinical HF might guide screening for early intervention and disease prevention. We hypothesised that the optimal cardiac markers vary with the underlying aetiology, and that the degree of underlying cardiac dysfunction correlates with their functional capacity measured by 6 min walk (6MW) test distance—a simple measure of the functional status of patients and a predictor of morbidity and mortality in left ventricular (LV) dysfunction.8
Methods
Patient selection
Asymptomatic individuals aged ≥65 years with HF risk factors were recruited through local media advertising based on the presence of ≥1 of the following HF risk factors: (1) hypertension (based on self-report of diagnosis including medication); (2) T2DM (based on self-report of diagnosis including medication); (3) obesity (body mass index (BMI) ≥30); (4) previous chemotherapy; (5) family history of HF and (6) previous history of heart disease (but not existing HF). The exclusion criteria were patients with (1) a history of HF, (2) a history of CAD, (3) a history (or evidence on baseline echocardiogram) of >moderate valvular heart disease, (4) LV ejection fraction (LVEF) <40% on baseline echocardiogram and (5) inability to acquire interpretable images for speckle-tracking imaging analysis at baseline. This study was performed in accordance with a research protocol approved by the Tasmanian Human Research Ethics Committee. A written informed consent was obtained from each participant after explaining the nature and purposes, complexity and level of risk of the study.
Data collection
Data were collected prospectively at facilities in the community from all participants enrolled in the study. All completed standard questionnaires relating to health status (EuroQol 5-dimension index, EQ5D), functional capacity (Duke Activity Score Index, DASI), frailty (Study of Osteoporotic Fractures (SOF) frailty index) and symptom status (Minnesota Living with Heart Failure Questionnaire, MLHFQ). Anthropometric measurements were obtained and BMI was calculated. Waist and hip measurements were obtained. Standard serial blood pressure (BP) measurements, standard 12-lead ECG and a comprehensive transthoracic echocardiogram including speckle-tracking imaging were performed. 6MW test was used to assess submaximal functional capacity.
Other collected data included socioeconomic indicators, complete medical history, family history, cardiovascular risk factors, heart rate and patient-reported outcome measures.
BP measurements
Peripheral and derived aortic BP readings were obtained using a validated technique,9 with a commercially available pulse wave analysis system (Mobil-O-Graph PWA, IEM, Stolberg, Germany). Serial measurements were conducted after a 10 min rest in a quiet room, with readings obtained twice in a seated position at rest and immediately after 6MW. To define active hypertension, an averaged (at least two) sitting systolic BP (SBP) ≥140 mm Hg or diastolic BP (DBP) ≥90 mm Hg was used as cut-off.10 ,11
Standard echocardiographic study
Standard transthoracic two-dimensional (2D) and Doppler echocardiographic studies were performed using a commercial system (Siemens ACUSON SC2000, 4V1c and 4Z1c probes, Siemens Healthcare, Mountain View, California, USA) in accordance with the American Society of Echocardiography guidelines.12 ,13 LV dimensions during diastole and systole and wall thicknesses were measured from parasternal long-axis views according to the recommended criteria. LV mass was calculated according to the guidelines and indexed for body surface area (BSA; g/m2). LV hypertrophy (LVH) was defined as LV mass index (LVMi) >115 g/m2 in men and >95 g/m2 in women.12 LV and left atrial (LA) volumes were calculated by the Simpson biplane method, and indexed to BSA (LAVi). Abnormal LAVi was defined as >34 mL/m2.12 For diastolic function assessment, mitral inflow peak early diastolic velocity (E), peak late diastolic velocity (A), E/A ratio and E wave deceleration time (DT) were measured; E/A<0.8 identified delayed relaxation. Tissue Doppler mitral annular early diastolic velocity (e′) was assessed at septal and lateral walls and averaged for calculation of E/e′; an average E/e′≥15 was considered consistent with raised filling pressure.
Myocardial strain
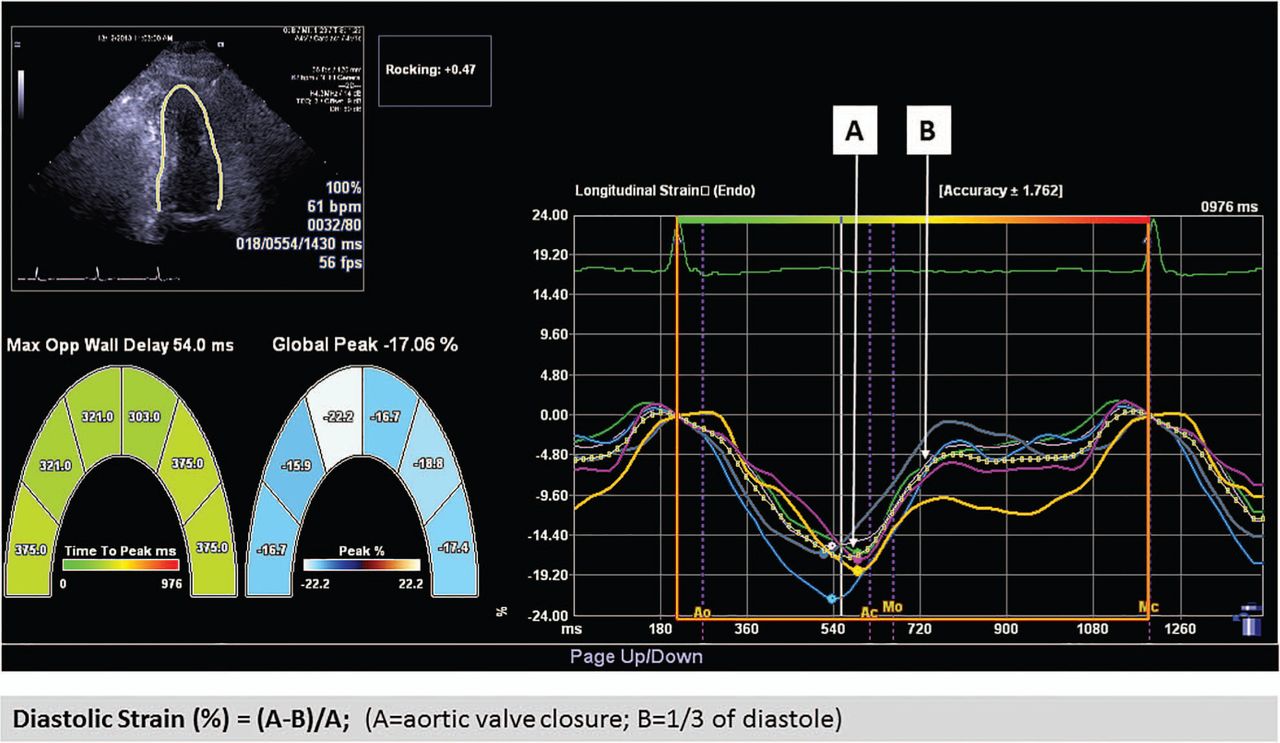
Speckle tracking was used for the measurement of global longitudinal strain (GLS), from three standard apical views, using commercial software (Syngo VVI, Siemens Medical Solutions). After manual tracing of LV endocardial border during end systole, this was automatically tracked throughout the cardiac cycle. GLS was obtained by averaging all 18 segment strain values from the three standard views; abnormal GLS is defined as >−18%.14 Global diastolic strain (DS) was obtained by averaging of all 18 segment strain values and measured according to method published by Ishii et al.15 Calculation of DS was determined as (A−B)/A×100% (A=the systolic value of strain at closure of aortic valve; B=the value of strain at the one-third point of diastole duration) (figure 1). DS rate (DSR) was determined from the average of 18 segments of early DSR.

Measurement of GLS and DS. DS, diastolic strain; GLS, global longitudinal strain.
Functional capacity assessment
The 6MW test distance was used for the measurement of submaximal functional capacity in this study. 6MW was conducted following a standardised protocol.16
Statistical analysis
Data are presented as mean±SD after testing for normal distribution with the Kolmogorov-Smirnov test. Data deviating from normality are expressed as median and IQR. Categorical variables are expressed as percentages. Multigroup comparison was performed by the analysis of variance (ANOVA) with Bonferroni post hoc analysis when data showed a normal distribution. Otherwise, the Kruskal-Wallis test was used for comparison of non-normally distributed variables. Linear regression analysis was used to examine the associations between clinical, echocardiographic and functional variables before and after adjustment for age, gender and other clinical variables. Logistic regression analysis was used to examine the association of low functional capacity and abnormal GLS. Statistical analysis was performed using a standard statistical software package (SPSS software 22.0, SPSS Inc, Chicago, Illinois, USA). Statistical significance was defined by p<0.05.
Results
Population characteristics
There were 535 community individuals potentially eligible for assessment during the study period. After exclusion of 14 individuals after the baseline echo screening due to valvular pathology and poor LVEF, the final number of individuals included in this study was 521 (age 71±5 years (IQR 67–74)), 49% of whom were men. All had completed assessment according to the standard protocol. The listed HF risk factors were present in all of these participants, with self-reported hypertension being the most common (82%), followed by T2DM (54%), obesity (47%), family history of heart disease at young age (36%), a known cardiac condition without overt HF (10%) and previous chemotherapy (9.2%). All had normal LVEF (≥50%). A total of 340 out of 521 participants (65%) met the criteria of active hypertension (SBP ≥140 mm Hg and or DBP≥90 mm Hg).
Four groups were derived according to the status of T2DM and the presence of hypertension, namely T2DM+/HTN−, T2DM/HTN+, T2DM+/HTN+ and T2DM−/HTN−. These four aetiological groups were studied to test the individual effect of hypertension versus T2DM and combined effect of T2DM+HTN (table 1). There was no difference in age and gender between T2DM−/HTN+ and T2DM+/HTN−. Other risk factors including obesity, chemotherapy, family history and history of heart disease were also similar between the two groups (table 1). However, compared with T2DM−/HTN+, T2DM+/HTN− had significantly higher prevalence of dyslipidaemia (p<0.001) and higher Atherosclerosis Risk in Communities (ARIC) and Framingham Heart Study (FHS) score (p<0.001). The T2DM+/HTN+ group had significantly greater BMI and dyslipidaemia. Baseline medication history (including β-blocker (BB), angiotensin-converting enzyme inhibitor (ACEi), angiotensin receptor blocker (ARB), diuretics and calcium antagonists) was similar. A greater percentage of participants with T2DM+/HTN+ were on statin therapy than other groups.
Baseline demographic and clinical characteristics of patients with stage A heart failure, categorised by aetiology
Echocardiographic assessment
Baseline echocardiographic measures stratified by the four aetiological groups are summarised in table 2. LVMi was higher in hypertensive groups (T2DM−/HTN+ and T2DM+/HTN+), but LVEF, LV end-diastolic volume (LVEDV) and relative wall thickness (RWT) were similar among the groups. Of the conventional diastolic parameters, mitral annular e′ (average of medial and lateral) was lower and E/e′ (average of medial and lateral) was higher in T2DM−/HTN+ and T2DM+/HTN+ than T2DM+/HTN−. Using E/e′ >15 as cut-off, the percentage of abnormal E/e′ in the groups was different (p=0.049). T2DM+/HTN+ had the highest prevalence of diastolic dysfunction (82%) according to the current recommendations of the American Society of Echocardiography,13 although this was not statistically significant among the groups.
Echocardiographic characteristics of patients with stage A heart failure, categorised by aetiology
Echocardiographic assessment using speckle-tracking analysis is also summarised in table 2. GLS was significantly lower in T2DM+/HTN− and T2DM+/HTN+. Using −18% as cut-off, abnormal GLS was present in 42% of the whole cohort, most commonly in those with T2DM (T2DM+/HTN− and T2DM+/HTN+). DS and DSR were reduced in T2DM−/HTN+, T2DM+/HTN− and T2DM+/HTN+. Comparison of conventional and speckle tracking echocardiography (STE). analysis measures among and between four groups is shown in figure 2A–H.

Association of LV function with four groups of hypertension and T2DM. Abnormal strain (A) but not EF (B). Diastolic markers (C–F), LV mass (G) and exercise capacity (H) were impaired in the presence of hypertension and T2DM. LV, left ventricular; T2DM, type 2 diabetes mellitus.
Association of hypertension and T2DM with cardiac changes
The association between abnormal functional parameters and T2DM and hypertension was tested using univariable analysis, followed by two multivariable models to test the independent association between T2DM, a history of hypertension and active hypertension (the latter two being entered into each model separately) (table 3). When modelled with age, gender, BMI and HR, reduced GLS was independently associated with T2DM but not hypertension (either history or active). In contrast, diastolic parameters were generally associated with active hypertension as well as T2DM.
Association of T2DM, history and actual hypertension with abnormal myocardial function
Association of exercise capacity with cardiac changes in hypertension and T2DM
The 6MW test distance in the entire cohort correlated with GLS (r=−0.11, p=0.01) and E/e′ (r=−0.10, p=0.03) but not other diastolic parameters or LV mass. 6MW distance in subgroups is shown in figure 2H. Compared with T2DM−/HTN−, T2DM−/HTN+ had preserved 6MW distance, while T2DM+/HTN− had a non-significant reduction and T2DM+/HTN+ had significantly lower 6MW distance (p=0.019). Multivariable analysis showed T2DM was independently associated with reduced 6MW in both models (history of hypertension and active hypertension). In contrast, active or history of hypertension was associated with preserved 6MW after adjustment for age, gender, height, SBP and heart rate (table 4). Table 5 summarises the association of 6MW distance with abnormal cardiac functional parameters, after adjusting for age, gender, height, HR, SBP and T2DM. 6MW was independently associated with GLS, DS and LVMi, not with other diastolic parameters. In multivariable logistic analysis using GLS (−18% cut-off) and 6MW (lower quartile distance: 410 cut-off), those with 6MW distance <410 m were associated with abnormal GLS with an OR of 1.61 (95% CI 1.07 to 2.42, p=0.02).
Association of 6MW distance with hypertension and T2DM status
Association of 6MW with echocardiographic measures
Discussion
This study demonstrated that in individuals with non-ischaemic stage A HF risks, T2DM is associated with more impaired cardiac function and reduced exercise capacity than is present in those with hypertension. Although patients with well-controlled and poorly controlled BP showed abnormal diastolic function, it appears that abnormal GLS is an independent marker for diabetic cardiomyopathy rather than hypertensive heart disease. Poor BP control is associated with more impaired cardiac function with or without the presence of diabetes.
Combined effect of T2DM and hypertension on LV function
Diabetes and hypertension constitute two powerful independent risk factors for cardiovascular disease. T2DM is known to be a strong predictor of incident HF, independent of other concomitant risk factors.6 ,17–21 Subclinical diastolic dysfunction and systolic impairment assessed using GLS are believed to be early markers of diabetic cardiomyopathy.5 ,18 However, hypertension is present in 40–80% of patients with long-standing diabetes,22 and most of these studies were performed in populations with a high prevalence of hypertension and therefore reflect the combined impact of hypertension and T2DM. In our study, patients with mixed T2DM and hypertension had a 20% prevalence of E/e′>15, analogous to a 23% prevalence in another community-based study of 1760 patients with T2DM with 86% of hypertension and 36% prevalence of CAD. Follow-up of that group showed that the HR of hypertension (HR 4.27, 95% CI 1.92 to 12.15) for subsequent HF was almost double that of CAD (HR 2.2, 95% CI 1.62 to 3.01). The negative synergistic effect of hypertension and diabetes was likely the cause of high prevalence of impaired diastolic and systolic dysfunction and associated adverse outcome.6 ,18 ,23 However, the exact underlying pathophysiology of this combined impact is unclear. Diabetes is a metabolic disorder characterised by intracellular accumulation of toxic fatty acid intermediates.24 This change also affects cardiac mitochondria, resulting in contractile dysfunction.25 There is a well-recognised tendency to develop diastolic dysfunction even in the absence of significant hypertension; however, the presence of hypertension may accelerate the adverse changes and cause end-organ damage.26 Quantitative measure using fibrosis score showed the degree of myocardial and interstitial fibrosis contributes to the pathological involvement.27 The score was found to be lowest for hypertensive, midrange for diabetic and highest for hypertensive diabetic. It is presumed that fibrosis and metabolic consequences of myocyte in diabetes lead to impaired systolic and diastolic function, while chronic afterload causes interstitial fibrosis, leading to a more impaired diastolic than systolic function in hypertension. The coexisting hypertension exacerbates functional changes by producing larger amount of fibrosis. Another observation was described that abnormal GLS and diastolic dysfunction were not analogous to each other. As an early marker, diastolic function was documented in 47% of patients with T2DM, Ernande showed abnormal strain in 28% of those with normal diastolic function.5 In multivariable analysis, a history of hypertension but not T2DM was associated with diastolic parameters. This relationship was mirrored in our study, in which the prevalence of diastolic dysfunction was 72% in those with T2DM with abnormal strain in 47% of them (table 2)—a higher prevalence found in our study was likely due to older age (71±5 vs 52±5 years) and higher prevalence of history of hypertension (67% vs 38%). A history of hypertension but controlled BP was associated with increased E/e′, which may represent a combined impact. The findings parallel the finding that hypertension (either historical or high BP at the time of the echocardiogram) was independently associated with e′ and E/e′ and diabetes was associated with E/e′.23
It needs to be noted that our finding of GLS consistently associated with diabetes but not hypertension in the multivariable analysis should not be interpreted as a normal GLS in this population. Influence of afterload on LV causing reduced GLS in early disease stage was described in animal model and human studies.28–30 Understanding these differences would be important and beneficial to guide effective screening and early intervention in the community as hypertension and diabetes are the two leading aetiologies of preclinical HF in this population.
Effects of controlled and uncontrolled hypertension on LV impairment
Hypertension has been shown to precede the development of HF in men and women.31 Although there have been improvements in the overall management of hypertension, there remain a significant number of hypertensive patients who remain untreated or fail to achieve optimal control.32 ,33 Of the 82% with a known history of hypertension in our study, 92% were on antihypertensive therapy, but only 33% had good control of BP (table 1). Our study demonstrated uncontrolled BP was independently associated with more severe cardiac dysfunction including abnormal e′, E/e′, DS, DSR and LV mass. However, GLS appeared to be relatively preserved in those with hypertension compared with those with neither hypertension nor T2DM. These findings are inconsistent with previous work in a small group of younger (46±14 years) hypertensive patients with controlled BP showing lower peak strain and strain rate at rest, with blunting of strain increment during exercise.29 The dependence of myocardial strain on haemodynamic conditions has been reported in hypertension34 ,35 and valve disease.36
Assessment of exercise capacity using 6MW
Impaired exercise capacity and functional changes during exercise were known to be early markers of subclinical LV dysfunction in patients with hypertension and diabetes.37–39 However, a standard exercise testing protocol is not feasible in community-based screening for subclinical LV dysfunction. Owing to its simplicity and inexpensiveness, the 6MW test is often used to estimate submaximal functional capacity in this setting; the predictive value of 6MW for peak oxygen uptake is of moderate accuracy.40 In our study, 6MW distance correlated with subclinical cardiac dysfunction and was significantly reduced in those with T2DM+HTN+ individuals but relatively preserved in those with hypertension alone.
Limitations
The present analysis was based on a cross-sectional sample from a clinical trial population of participants aged ≥65 years with at least one of the listed non-ischaemic stage A HF risks. The control group without T2DM or hypertension had other HF risks (mainly obesity), but there were no age-matched controls without HF risk factors. Another important limitation of this study was the concomitant presence of CAD was not assessed. Our intention and focus was on non-ischaemic population with a very low prevalence of known CAD (<5%). However, diabetic cardiomyopathy and hypertensive heart disease are known as part of atherosclerosis process, which make their heart susceptible to ischaemia coronary changes. Some of the functional change may be caused by underlying ischaemic and non-ischaemic pathophysiological changes. A possible approach to address this limitation would be a stress test to identify those with underlying CAD, but we could not perform this in the context of a community-based study.
Conclusions
Hypertension is associated with less impairment of GLS and exercise capacity than is T2DM. Those with well-controlled and poorly controlled BP showed abnormal diastolic functional markers, and more severely impaired cardiac function was associated with worse BP control. However, GLS appears to be associated with diabetic cardiomyopathy rather than hypertensive heart disease in this population at risk of HF.
Acknowledgments
The authors gratefully acknowledge the contribution of our tireless volunteer coordinators, Diane Binns and Jasmine Prichard.
References
Footnotes
Contributors HY designed the study, gathered and analysed the data, and wrote the first draft. YW, KN and MN assisted with gathering and analysis of the data and contributed to the revision of drafts. THM designed the study, analysed the data and edited the drafts.
Funding This study was partially supported by Tasmanian Community Fund and Diabetes Australia Research Trust. HY is supported by a Health Professional Scholarship from the National Heart Foundation of Australia (100307).
Competing interests None declared.
Ethics approval The study was approved by the Human Research Ethics Committees of participating centres in Australia and New Zealand, and the NRES Committee East Midlands—Nottingham in the UK.
Provenance and peer review Not commissioned; externally peer reviewed.
Data sharing statement No additional data are available.