Article Text

Abstract
Objectives The aim of this study was to evaluate the accuracy of the Multifunction CardioGram (MCG) in detecting the presence of functionally significant coronary ischaemia.
Methods and results This prospective study evaluated the accuracy of the MCG, a new ECG analysis device used to diagnose ischaemic coronary artery disease (CAD). A consecutive 112 participants suspected to have CAD who were scheduled for elective coronary angiography (CAG) from October 2012 to December 2013 were examined. Their predictive values of relevant ischaemia were measured by MCG, standard ECG and Framingham Risk Score (FRS) and compared. Five levels of ischaemia based on CAG findings adjusted by fractional flow reserve (FFR) values and three levels of MCG score of high, borderline or low were used. The MCG (OR=2.67 (1.60 to 4.44), p<0.001) was the only test significantly associated with ischaemia level. The FFR values for individual MCG scores with low, borderline and high were 0.77 (0.70 to 0.86), 0.78 (0.71 to 0.82) and 0.69 (0.65 to 0.77), respectively, p=0.042. A high MCG score had a specificity of 90.4% (87.0% to 93.9%) in model 1 adjusted by FFR≤0.8 threshold and of 87.0% (83.2% to 90.8%) in model 2 adjusted by FFR≤0.75 threshold, and a negative predictive value of 82.5% (78.3% to 86.7%) in model 1 and of 83.8% (79.6% to 87.9%) in model 2 for the prediction of severe ischaemia.
Conclusions The MCG showed high specificity with a high negative predictive value, suggesting that the MCG could be used not only to identify functionally significant ischaemia but to reduce unnecessary CAGs.
Trial registration number UMIN ID: 000009992.
This is an Open Access article distributed in accordance with the Creative Commons Attribution Non Commercial (CC BY-NC 4.0) license, which permits others to distribute, remix, adapt, build upon this work non-commercially, and license their derivative works on different terms, provided the original work is properly cited and the use is non-commercial. See: http://creativecommons.org/licenses/by-nc/4.0/
Statistics from Altmetric.com
Key questions
What is already known about this subject?
-
The Multifunction CardioGram (MCG) is a new computer-enhanced, multiphase, resting ECG analysis device that improves the quality of non-invasive tests. However, in previous trials that used MCG to detect the presence of relevant coronary artery disease, only a coronary angiography was the gold standard.
What does this study add?
-
This prospective study was designed to evaluate the accuracy of MCG in diagnosing patients with coronary artery disease with functionally significant ischaemia defined by not only coronary angiography but fractional flow reserve reference standards.
How might this impact on clinical practice?
-
The MCG might have the strength to identify functionally significant coronary ischaemia needing an optimal revascularisation.
Introduction
Various types of cardiac stress tests, including ECG stress tests, nuclear scintigraphy and stress echocardiography, are standard non-invasive techniques for the evaluation of cardiac ischaemia.1–3 While these techniques are recognised as sensitive tests for the detection of coronary artery disease (CAD) in two or more large epicardial vessels, it is also acknowledged that they have a relatively poor specificity. There is a growing consensus that the poor specificity results in a significant number of unnecessary coronary angiographies (CAGs), thereby potentially subjecting many patients to the risks of invasive procedures and radiation exposure without commensurate clinical benefit.4 ,5
The Multifunction CardioGram (MCG) is a new computer-enhanced, multiphase, resting ECG analysis device that improves the quality of non-invasive tests. It has been used to determine the optimal decision-making algorithm for the evaluation of suspected obstructive CAD.6–9 The potential benefit of revascularisation depends on the presence of myocardial ischaemia, therefore careful identification of ischaemia-inducing stenosis allows for a greater benefit from revascularisation, especially in patients with stable angina pectoris (SAP).10–15 However, in previous trials that used MCG to detect the presence of relevant CAD, an immediate and subsequent CAG was the gold standard, without use of fractional flow reserve (FFR).6–9
The aim of this study, therefore, was to evaluate the accuracy of the MCG in detecting the presence of cardiac ischaemia by comparing its measurements with CAG and FFR in a relatively high-risk population who were scheduled for elective CAG, taking into account standard ECG and Framingham Risk Scores (FRS).
Methods
Patients and study design
This prospective study was designed to evaluate the accuracy of MCG in diagnosing patients with CAD with severe ischaemia defined by CAG and FFR reference standards. Our target population was 112 consecutive participants with or without known CAD who were scheduled for elective CAG from October 2012 to December 2013. The exclusion criteria of this study were patients on haemodialysis (n=2), those with elevated preprocedural cardiac biomarkers such as troponin-T (n=5), prior coronary artery bypass graft (CABG) surgery (n=2) and MCG of poor quality (n=3). Thus, the final study population was 100 patients. This study was approved by the Institutional Review Board at Chubu Rosai hospital, all patients provided written informed consent, and the study was consistent with principles of the Declaration of Helsinki.
Multifunctional cardiogram
Each MCG test was taken and analysed prior to performing the CAG. An ECG was performed and 82 s of resting signal were collected from leads II and V5. The data were subsequently analysed and transformed by multiple mathematical functions (power spectra, cross correlation, coherence) resulting in a number of indices that were compared to a large database of patients with a broad range of clinically verified myocardial ischaemia. Test results were blinded to the angiographer. The MCG (Toray Medical Co Ltd) and associated computer with the MCG software V.2.1.1 (Premier Heart Japan Inc) were used. Three to five tests were taken at each session. Only those tests with marginal or better quality trace, which was checked automatically by the system, were sent for analysis to the PH LLC data centre through internet. The MCG device and database used have been previously described.16 In brief, the database against which the incoming MCG data are compared originated from data gathering trials conducted from 1978 to 2000 in more than 30 institutions in Europe, Asia and North America on ∼100 000 individuals of varying ages and degrees of coronary disease. The MCG reports also indicate the level of myocardial damage and severity integrated into a score; other information such as coronary damage, area of damage, and myocardial pathological and pathophysiological conditions are included in the report. An MCG score of four was used as the cut-off score in the majority of published clinical trials.9 ,17 In the present study, we used a cut-off score of four but investigated the scoring method further. Patients were divided into three groups: high MCG score, minimum score among 3–5 tests at one session ≥4.0; borderline MCG score, 4.0> all scores ≥3.0; low MCG score, maximum score among 3–5 tests at one session <3.0.
Standard ECG and FRS
Specific ECG findings that were defined as positive were ST-segment depression, T-wave inversion and pathological Q waves.18 ,19 The FRS was also calculated for each case.20 ,21 The patients were then categorised according to tertiles of risk score of high, intermediate and low.
CAG and FFR measurement
Before performing a CAG, an intracoronary injection of 0.5 mg isosorbide dinitrate was administered to prevent coronary spasm. Cineangiograms were analysed by an independent angiographer who was unaware of the MCG test results. FFR was calculated as previously described.13–15 In brief, equalisation was performed with the guide wire sensor positioned at the guiding catheter tip. The 0.014-inch pressure guide wire (St Jude Medical, Minneapolis, Minnesota, USA) was then advanced distally to the stenosis, and FFR was measured at maximal hyperaemia induced by intravenous ATP administered at 150 µg/kg/min through a central or forearm vein. It was then calculated as the mean distal coronary pressure divided by the mean aortic pressure during maximal hyperaemia. Functional significance was defined as FFR values ≤0.80 in model 1 and ≤0.75 in model 2. The present study recommended that FFR should be measured in vessels that have intermediate stenosis (26–90% of the vessel diameter). FFR measurements were deferred when vessels had obvious severe lesions (>99%) with a delayed coronary flow or had no significant stenosis (≤25%) as observed on CAG.
Ischemic Severity Score
Initially patients were categorised based on the percentage and location of stenosis estimated visually by CAG.22 ,23 Five ischaemic grades were used; level 5 (severe), triple vessel disease or left main disease; level 4 (high), 99% stenosis in a proximal lesion; level 3 (moderate), 75–90% stenosis in a proximal lesion, or 99% stenosis in a distal lesion; level 2 (mild), 75–90% stenosis in a distal lesion; and level 1 (normal), stenosis of 50% or less. The location of stenosis was defined as the following: proximal for lesions in the right coronary artery (RCA) #1–2, left anterior descending artery (LAD) #6–7, left circumflex artery (LCX) #11; distal for lesions in the RCA #3–4, LAD #8–10, LCX #12–15. Next, the ischaemic grade was adjusted based on the FFR cut-off value of 0.80 as follows: levels 1 and 2 were adjusted to level 3 if the FFR was ≤0.80 in model 1 or ≤0.75 in model 2. Levels 5, 3 and 2 were adjusted to levels 3, 2 and 1, respectively, when the FFR was >0.80 in model 1 and >0.75 in model 2. Revascularisations such as percutaneous coronary intervention (PCI) and CABG were performed for patients with obvious severe stenosis (>99%) or for lesions with the FFR ≤0.80.
Definition of clinical characteristics
Diabetes mellitus was defined if the patient was taking any antihyperglycaemic medication or had previously been diagnosed with diabetes mellitus. Hypertensive patients were those with documented blood pressure of >130/85 mm Hg on two or more occasions, or who were already on antihypertensive therapy. A positive smoking status was defined if the patient currently smoked or had quit less than a year before entering the study. Chronic kidney disease stages were defined according to estimated glomerular filtration rate levels.
Statistical analyses
Categorical data were summarised as frequency (%) and continuous data were expressed as mean and SD, or median and IQR as appropriate. For evaluating the relationship between the ischaemia level and three tests as predictors, the OR was calculated by applying a cumulative logit regression model on each of the three tests. We also conducted a logistic regression analysis to estimate the OR for the need for revascularisation. The Akaike Information Criterion (AIC) was used to compare the goodness of fit between the three models. Smaller AIC values indicate better fit. Dichotomised data were used to calculate the accuracy, sensitivity, specificity, and positive and negative predictive value (NPV) with a 95% CI. Agreement between the ischaemia level and three tests was evaluated by using Cohen's κ coefficient. Sensitivity was calculated by dividing the number of patients in which a test was positive and in whom the ischaemia level was four or five (considered a true positive) by the total number of patients in which the ischaemia level was four or five. Specificity was calculated by dividing the number of patients in which a test is negative and the ischaemia level was one, two or three (considered a true negative) by the total number of patients in which the ischaemia level was one, two or three. Accuracy was calculated by dividing the number of patients with true positive or negatives by the total number of patients. We constructed two receiver operating curve (ROC) plots, one without taking the collateral cases into account and another with the collateral cases (all participants) to show the difference in MCG diagnostic accuracy. Three groupings of MCG scores (low, borderline and high) were evaluated using analysis of variance (ANOVA), and Fisher's least significant difference test for multiple comparisons to determine their associations with the FFR values was used with ANOVA. When the plural FFR values were available for one patient, the minimum FFR value was adopted. A value of p<0.05 was considered statistically significant. All statistical analyses were performed with the SAS V.9.3 (SAS Institute, Cary, USA) software.
Results
Baseline characteristics
Table 1 outlines the baseline clinical characteristics of all 100 patients. Forty per cent of patients had diabetes. Nearly 60% of patients had class I and II angina as measured by the Canadian Cardiovascular Society scale. Thirty-one per cent of patients were asymptomatic. Nearly 80% of patients were taking statin therapy. Table 2 shows diagnosis test, angiographic and FFR findings. Twenty patients (20%) had a high MCG score. There were a total of 127 lesions (>25% of diameter) in 89 patients (89%), and 11 (11%) had no significant stenosis. The collateral circulations were observed in 14 lesions (11%) with 14 patients (14%). The FFR was measured in 75 patients (75%), in a total of 121 vessels. There were 57 lesions (47%) with an FFR value <0.80. Revascularisations (PCI or CABG) were performed in 55 (55%) of all patients.
Baseline clinical characteristics
Diagnosis tests and angiographic and FFR findings
Association between MCG, ECG and FRS and ischaemia levels
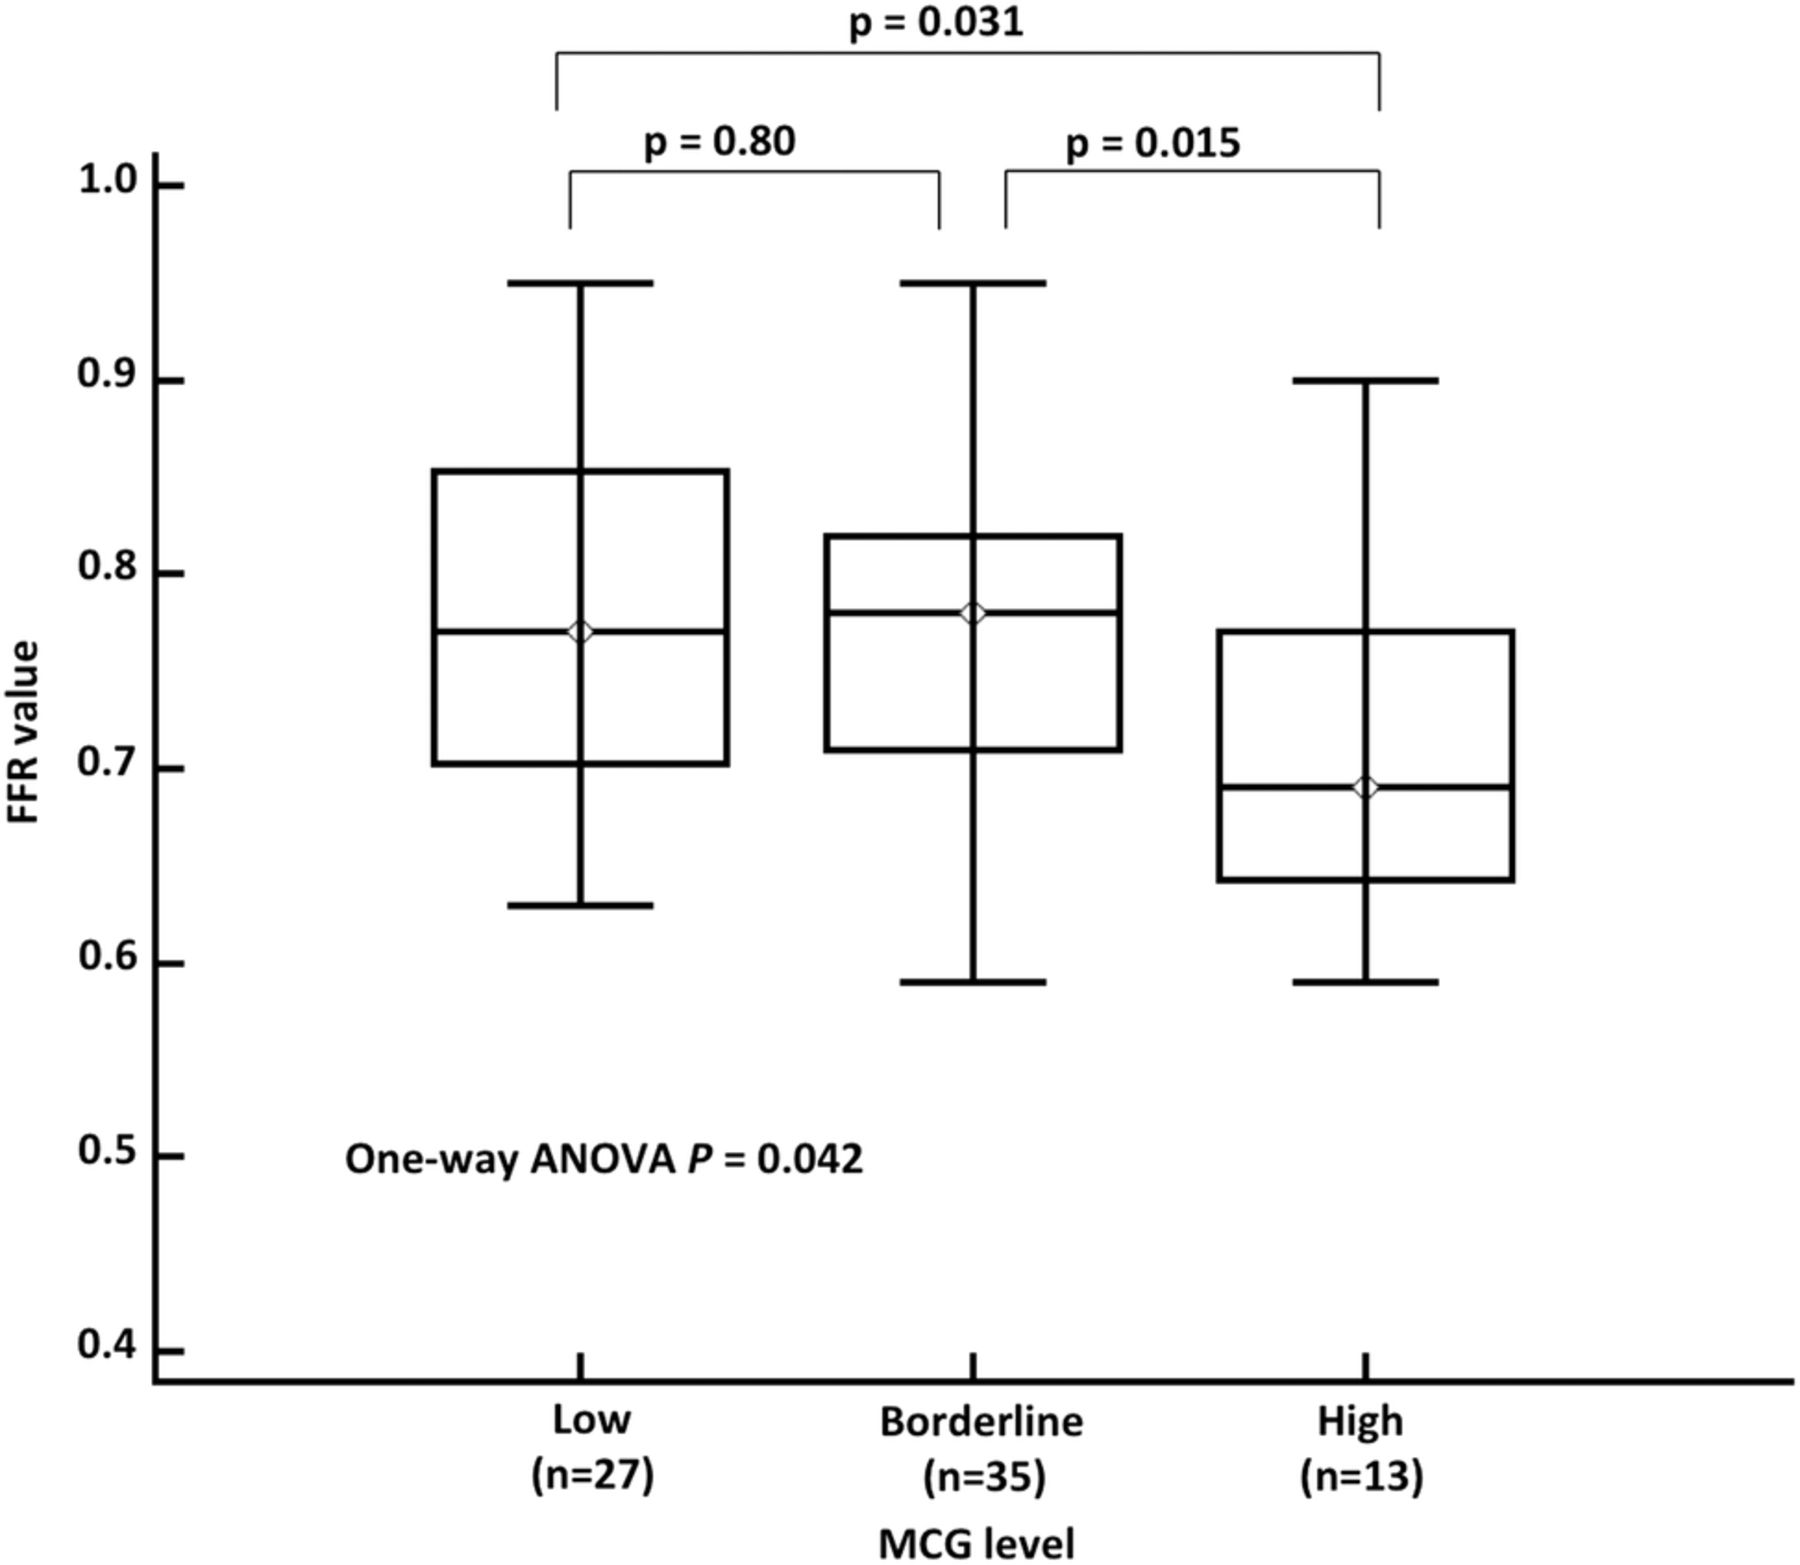
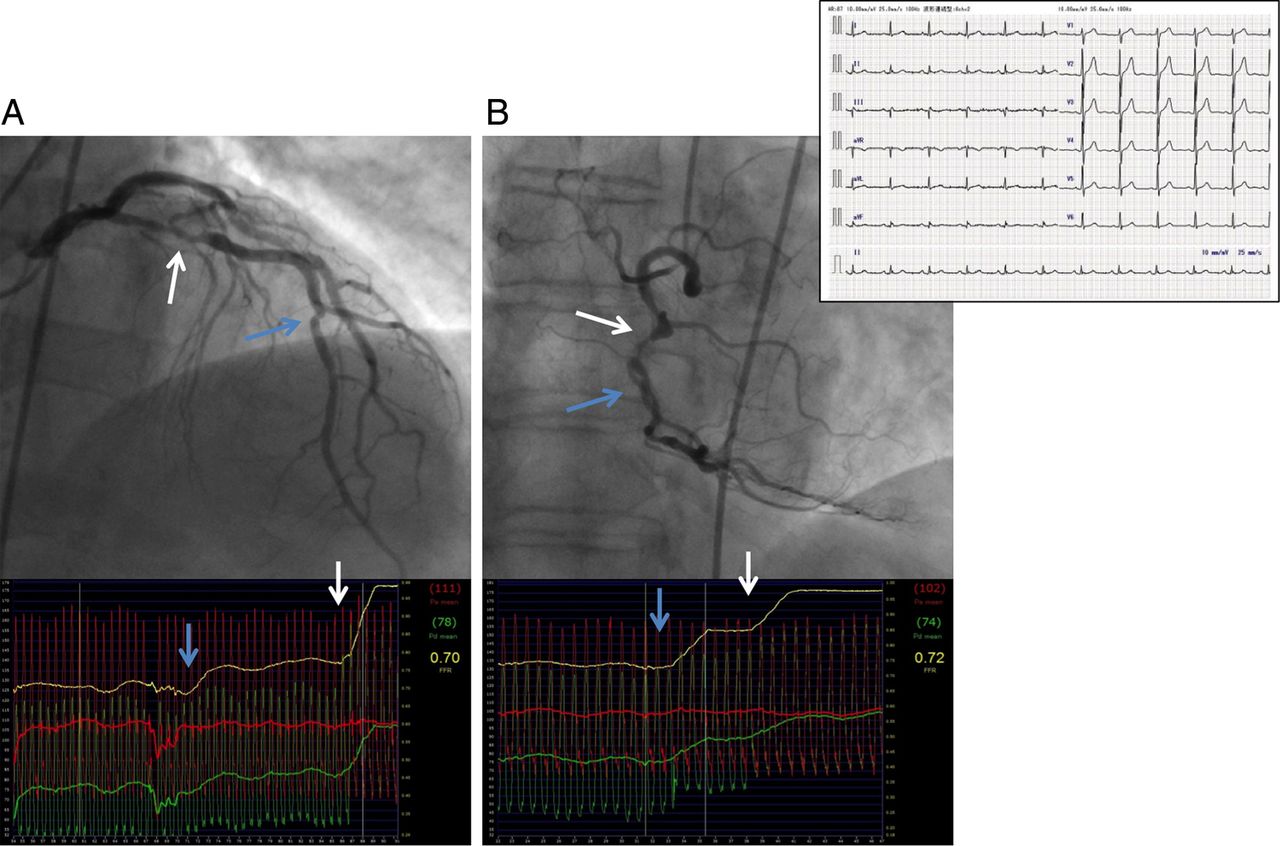
Table 3 shows the cumulative logit model analysis of the three tests for prediction of ischaemia levels. The MCG (OR=2.67 (1.60 to 4.44), p<0.001 in model 1 and OR=2.39 (1.44 to 3.94), p<0.001 in model 2) was the only test significantly associated with ischaemia level. As shown in figure 1, the MCG level (low, borderline and high) was significantly associated with an increasing level of ischaemia (level 1–5). Figure 2 shows the FFR values for individual MCG scores with low, borderline and high. The FFR values were significantly associated with an increasing risk of the MCG score (p ANOVA=0.042). Table 4 shows the predictive values of severe ischaemia (level 4 and 5) by MCG (high vs borderline/low), ECG (positive vs negative) and FRS (high vs intermediate/low). A high MCG score (≥4.0) had a specificity of 90.4% (87.0% to 93.9%) in model 1 adjusted by FFR≤0.8 (table 4A), and of 87.0% (83.2% to 90.8%) in model 2 adjusted by FFR≤0.75 (table 4B), and a NPV of 82.5% (78.3% to 86.7%) in model 1 and of 83.8% (79.6% to 87.9%) in model 2 for the prediction of severe ischaemia. In examining the κ coefficient in all patients, the MCG (0.42 (0.22 to 0.62)) was significantly superior to the ECG (0.12 (−0.08 to 0.33), p=0.020) and FRS (0.16 (0.02 to 0.31), p=0.024) in model 1. The MCG showed a relatively high predictive accuracy of approximately 80%, irrespective of gender. The area under the ROC (AUC) for the MCG score in prediction of severe ischaemia was 0.66 (0.55 to 0.75) in model 1 and 0.63 (0.53 to 0.73) in model 2. The optimal cut-off value identified by ROC analysis was 4.8 in model 1 and model 2, with a sensitivity of 48.1% and a specificity of 87.7% in model 1, and a sensitivity of 43.5% and a specificity of 84.4% in model 2 (figure 3A). In our study, there were 14 patients having a well-established collateral circulation. When these patients were excluded from analysis, the AUC for the MCG score increased to 0.74 (0.64 to 0.83) in model 1 and 0.76 (0.66 to 0.85) in model 2. The optimal cut-off value, sensitivity and specificity for the prediction of severe ischaemia were 4.8, 60.0% and 87.3% in model 1 and 3.0, 91.7% and 58.1% in model 2, respectively (figure 3B). Figure 4 shows the representative images of CAG and FFR from a patient who showed no resting ECG abnormality. The average MCG value of this patient was 6.0, and two vessel disease in the proximal LAD (FFR=0.70) and the mid RCA (FFR=0.72) were found.
Cumulative logit model analysis of three tests for prediction of ischaemia level (levels 1–5)
Predictive value of severe ischaemia (levels 4 and 5) by MCG, ECG and FRS
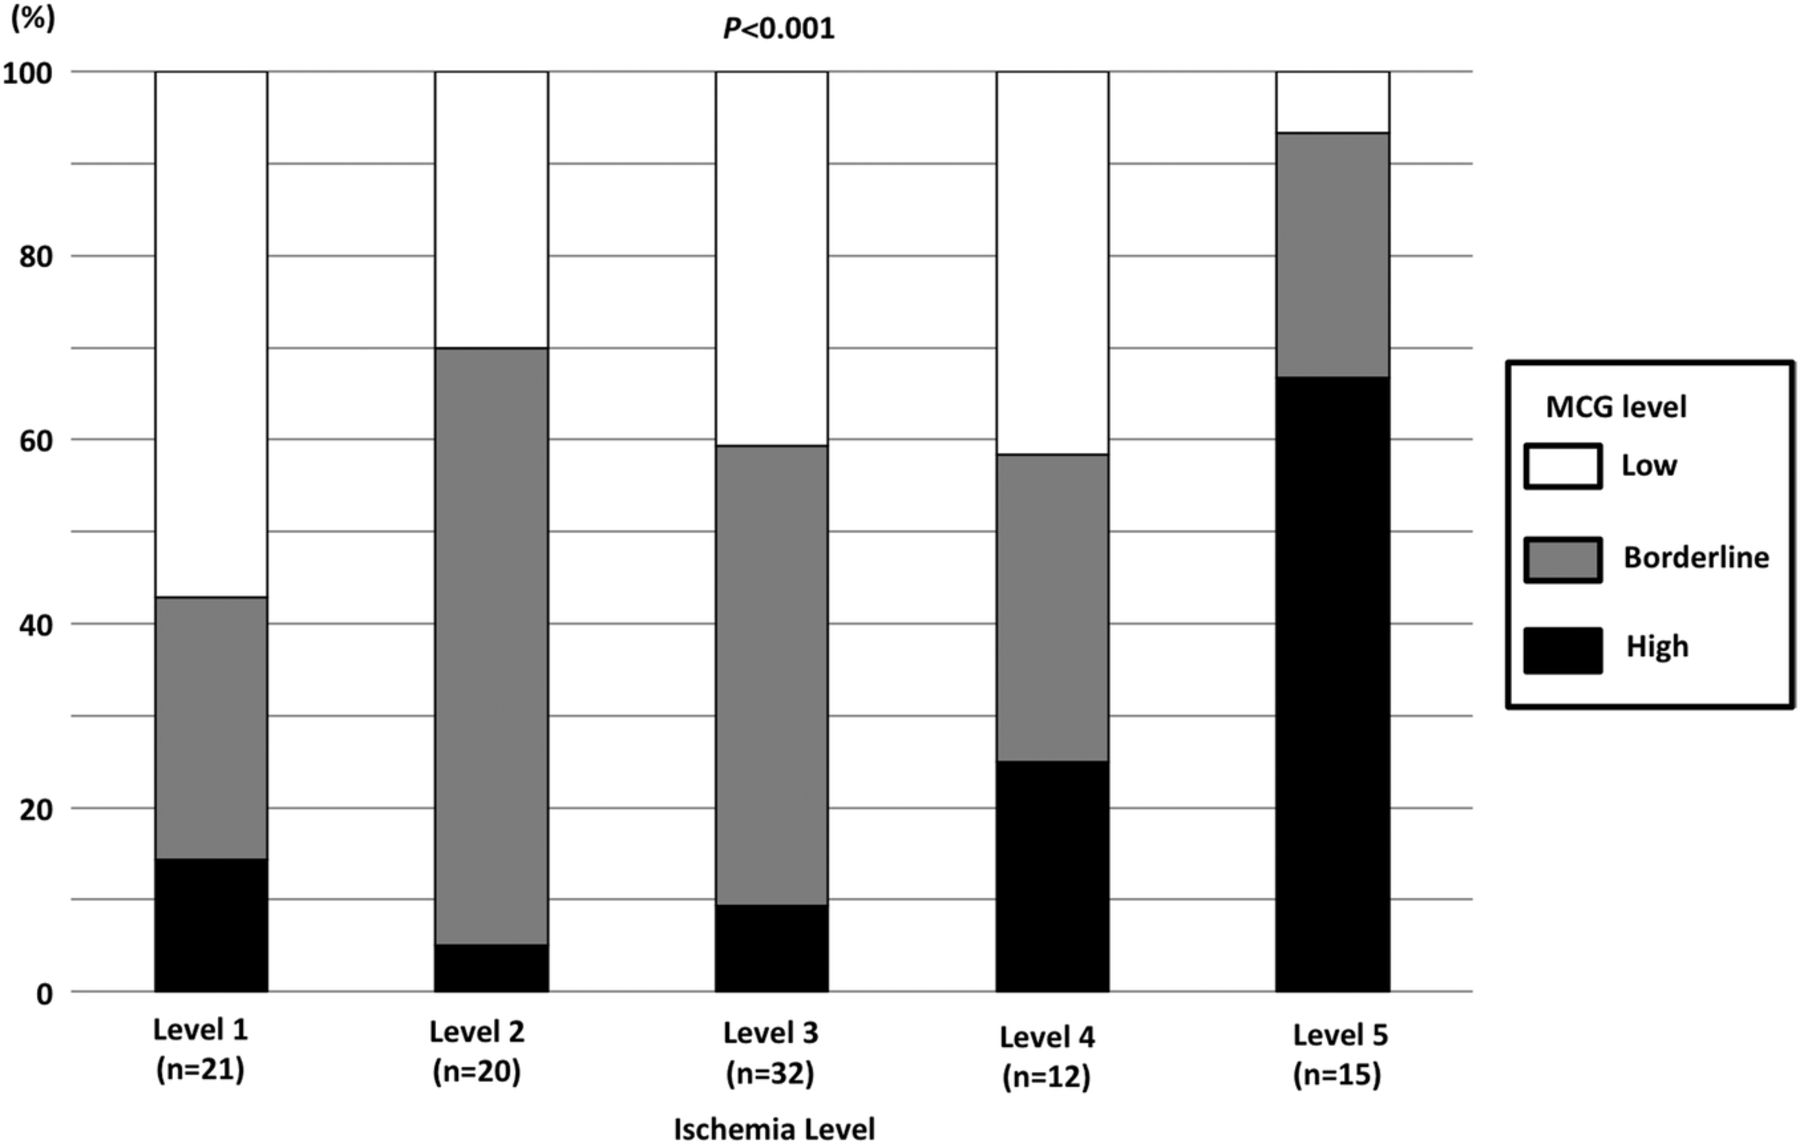
Proportion of Multifunction CardioGram (MCG) levels (low, borderline and high) in each ischaemia level (level 1–5). The MCG level was significantly associated with an increasing level of ischaemia.

The fractional flow reserve (FFR) values according to increasing risks of the Multifunction CardioGram (MCG) scores. The FFR values were significantly associated with an increasing risk of the MCG score (p analysis of variance (ANOVA)=0.042). The FFR values for individual MCG scores with low, borderline and high were 0.77 (0.70 to 0.86), 0.78 (0.71 to 0.82) and 0.69 (0.65 to 0.77), respectively.

(A) ROC analyses of the MCG score for the prediction of severe ischaemia (levels 4 and 5) in all participants. The area under the receiver operating curve (ROC) for the Multifunction CardioGram (MCG) score in prediction of severe ischaemia was 0.66 (0.55 to 0.75) in model 1 and 0.63 (0.53 to 0.73) in model 2. The optimal cut-off value identified by ROC analysis was 4.8 in model 1 and model 2 with a sensitivity of 48.1% and a specificity of 87.7% in model 1 and a sensitivity of 43.5% and a specificity of 84.4% in model 2. (B) ROC analyses of the MCG score for the prediction of severe ischaemia (levels 4 and 5) in patients without collateral circulation. When these patients are excluded from analysis, the area under the ROC for the MCG score increased to 0.74 (0.64 to 0.83) in model 1 and 0.76 (0.66 to 0.85) in model 2. The optimal cut-off value, sensitivity and specificity for the prediction of severe ischaemia were 4.8, 60.0% and 87.3% in model 1, and 3.0, 91.7% and 58.1% in model 2, respectively.

Representative images of coronary angiography and fractional flow reserve (FFR) from a patient who showed no resting ECG abnormality. The average Multifunction CardioGram value of this patient was 6.0, and two vessel disease in the proximal left anterior descending artery (FFR=0.70) in panel A, and the mid right coronary artery (FFR=0.72) in panel B were found. Arrows show the jump up points of FFR.
Discussion
In the present study, the MCG, a new computer-enhanced, multiphase, resting ECG analysis device, was significantly associated with the severity of coronary ischaemia as determined by CAG and FFR, in a relatively high-risk population with or without known CAD. All patients were scheduled for an elective CAG, and the MCG showed a relatively high predictive accuracy of approximately 80%, irrespective of gender.
Recently, Patel et al24 published an analysis of the American College of Cardiology National Cardiovascular Data Registry, which included 397 954 patients without known CAD who were undergoing elective CAG. CAD was absent in 39.2% of these patients. The authors created four separate models for the prediction of positive results in CAG: (1) FRS alone; (2) FRS plus clinical factors; (3) FRS, clinical factors and presence of symptoms; and (4) results of non-invasive testing. They concluded that although a positive non-invasive test was associated with the presence of obstructive CAD, the addition of information obtained from non-invasive tests had a limited effect on the model's predictive ability over and above the effect achieved from the addition of clinical risk factors and symptoms. This large and important study clearly identifies the limitations of non-invasive testing in selecting patients most likely to benefit from CAG. The diagnostic performance compares favourably to other non-invasive diagnostic tests. A review of stress scintigraphy studies reported a wide range of sensitivities from 44% to 89% and specificities of 89–94% for two vessel disease.25 Numerous studies of exercise ECG as a diagnostic tool for CAD have been conducted, and reported sensitivities range from 31% to ≥90%, while specificities range from 46% to nearly 100%.
The data presented in this study on sensitivity, specificity and NPV of 48.1%, 90.4% and 82.5%, respectively, for the detection of severe ischaemia are considerably equal or superior to those of the most widely used stress ECG and stress perfusion imaging. These relatively high specificities confirm the strength of the MCG device in reducing unnecessary CAGs. Additionally, the use of MCG in clinical practice could be reliably extended to patients who have difficulty in exercising and who have economic limitations.
In our study, ROC analyses excluding patients with a well-established collateral circulation improved the sensitivity of the prediction of severe ischaemia from 48.1% to 60.0%. This finding suggests the limitation of the MCG device in situations of critical stenosis in an epicardial vessel with a well-established circulation. This may result in a reduction in myocardial ischaemia, leading to a false-negative result. More importantly, using these unique categorisations of patients will lead to a better understanding of their pathology. Further studies are needed in this regard.
In the most recent trial, the MCG has been shown to safely and accurately identify patients with relevant coronary stenosis determined by CAG alone.6–9 In cases of PCI in patients with SAP, careful identification of ischaemia-inducing stenosis is essential for obtaining the greater benefit from revascularisation.10–13 In other words, the information from functionally significant ischaemia in addition to CAG findings provides a potential benefit in determining the indication of PCI, especially in patients with SAP.
Limitations
The limitation of the present study is the recruitment of patients. The patients in this study represented a relatively high-risk population with or without known CAD who were scheduled for elective CAG; this may limit the generalisation of our results. However, FFR used during CAG was performed for an intermediate lesion to determine the functional ischaemia, thus, recruitment of patients who did not plan a CAG was an ethical dilemma. In addition, this study assessed the accuracy of the MCG by use of the FFR and used the ischaemic severity score as a reference for functional ischaemia. However, prognostic impact of the reference for ischaemia used remained elusive. Further study is needed in this regard.
Conclusions
In conclusion, the MCG showed a high specificity and high NPV regardless of gender in relatively high-risk patients, suggesting that the MCG could identify relevant severe ischaemia. In addition, the potential use of MCG in the evaluation of ischemic CAD appeared to be more feasible than standard ECG and FRS.
References
Footnotes
-
Competing interests None.
-
Patient consent Obtained.
-
Ethics approval Obtained.
-
Provenance and peer review Not commissioned; externally peer reviewed.
-
Data sharing statement No additional data are available.