Article Text

Abstract
Background Late gadolinium enhancement (LGE) on cardiac MRI (CMR) has been described as an independent predictive factor of cardiovascular events among patients with hypertrophic cardiomyopathy (HCM). LGE and Q waves are considered as myocardial scar markers but their relation in the context of HCM is poorly established and has to be more supported. The objective of the study was to compare ECG findings in the presence or absence of LGE.
Methods 42 patients with HCM confirmed by CMR were included in the study. ECG abnormalities including abnormal Q waves and five ECG scores of left ventricular hypertrophy were assessed and compared according to LGE presence and its extension. Some CMR features, such as septal to posterior wall thickness ratio, were also studied according to the presence of LGE and the presence of abnormal Q waves.
Results Abnormal Q waves were more prevalent in the LGE (+) group (60% vs 12%; p=0.002), but there was no correlation between location of Q waves on ECG and territory of LGE on CMR. Among patients with LGE, quantitative analysis of LGE was not different in the presence or absence of Q waves. In contrast to the LGE mass, septal to posterior wall thickness was higher in patients with abnormal Q waves (2.3±0.7 vs 1.6±0.5; p=0.012).
Conclusions Although abnormal Q waves were more prevalent in the presence of LGE, no correlation was found with the LGE location and extent. These data suggest that abnormal electrical activation of the hypertrophied ventricular septum represented by a high septal to posterior wall thickness ratio seems to be an important mechanism of abnormal Q waves in HCM.
This is an Open Access article distributed in accordance with the Creative Commons Attribution Non Commercial (CC BY-NC 3.0) license, which permits others to distribute, remix, adapt, build upon this work non-commercially, and license their derivative works on different terms, provided the original work is properly cited and the use is non-commercial. See: http://creativecommons.org/licenses/by-nc/3.0/
Statistics from Altmetric.com
Key messages
What is already known about the subject?
-
Relation between Q waves on electrocardiogram and late gadolinium enhancement on MRI reflecting myocardial fibrosis has been demonstrated by some studies.
What does this study add?
-
Our study described a higher prevalence of Q waves in patient with myocardial late gadolinium enhancement on MRI but without correlation concerning extent and location of late gadolinium enhancement (LGE) and Q waves. We suggested that Q waves are mainly explained by abnormal electrical activation due to asymmetrical hypertrophy.
How might this impact on clinical practice?
-
LGE on MRI is associated with worse prognosis in hypertrophic cardiomyopathy (HCM). but absence of strong correlation with Q waves should not allow us considering Q waves as surrogate endpoint to predict LGE. MRI has to be performed to precise extent and location of LGE in HCM. Secondly, pathologic Q waves on ECG could suggest an asymmetrical hypertrophy and could lead to further exploration in asymptomatic patient in order to screen HCM.
Introduction
Hypertrophic cardiomyopathy (HCM) is a relatively common genetic cardiac disease and the most frequent cause of sudden cardiac death (SCD) in young people including athletes.1 ,2 HCM is a heterogeneous disease with a diverse anatomical and clinical presentation and course.1 ,3–5 Several risk markers for ventricular arrhythmia and SCD have been described and applied to manage the primary prevention of SCD in clinical practice with the use of implantable cardioverter-defibrillators therapy.
Cardiac MRI (CMR) may be considered as the gold-standard technique to assess left ventricular (LV) volume and mass4 ,6 and consequently for the diagnosis of the different phenotypic patterns of HCM.3 ,5 ,7 ,8 CMR also contributes to the detection of myocardial fibrosis by late gadolinium enhancement (LGE) imaging.9 ,10 LGE has a high prevalence in HCM that may vary from 57% to 79%,11 ,12 and its predictive role for cardiovascular death and SCD has been widely suggested.6 ,10 ,13 Recently, a meta-analysis including four studies and 1063 patients described extensive LGE as a significant predictive tool for adverse cardiovascular events in HCM.2 ,5 ,6
ECG is abnormal in 75–95% of patients with HCM and is useful for the screening of HCM.1 The patterns of ECG abnormalities are large and their mechanisms largely studied with poor correlation to morphology and severity of hypertrophy.1 ,14 ,15 Pathologic Q wave in HCM is one of the most studied ECG findings with different pathophysiology described.16 ,17 In the era of CMR, some studies suggested an association between abnormal Q wave and LGE.14 ,18 ,19 However, few studies compared ECG findings to the mere presence of LGE.
The main aim of our study was to compare ECG characteristics including abnormal Q waves to the presence of LGE assessed by CMR and to identify ECG parameters that might be predictors of LGE.
Materials and methods
Study population
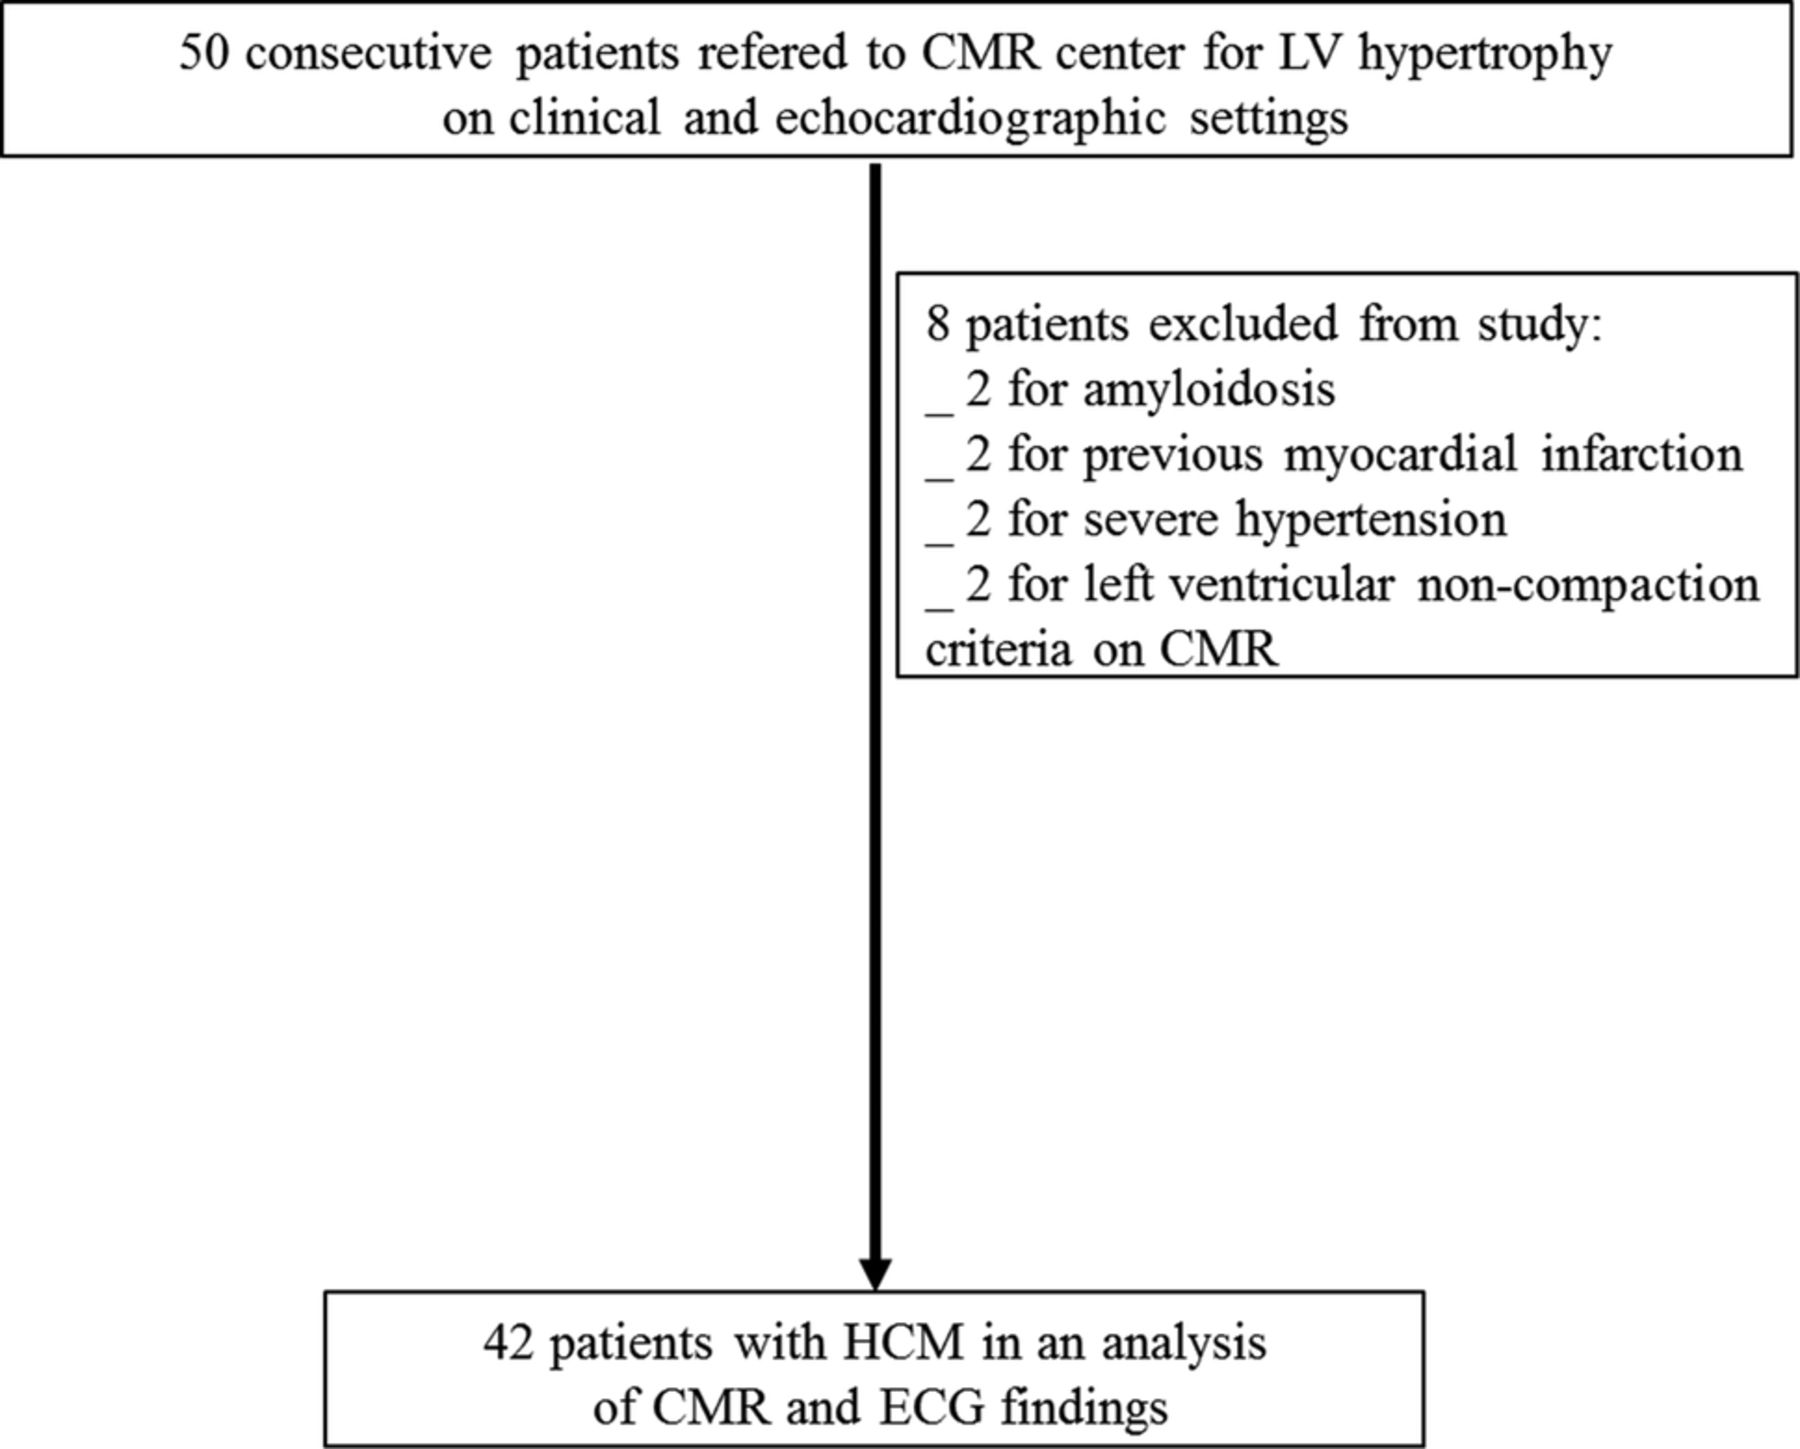
Fifty consecutive patients with HCM referred to a university hospital for a CMR assessment between February 2008 and May 2012 were studied retrospectively. Diagnosis of LV hypertrophy (LVH) was made by two-dimensional echocardiography and confirmed by CMR analysis. Morphological diagnosis of HCM was based on the association of unexplained LVH (maximal wall thickness ≥15 mm in sporadic adult patients or ≥13 mm in adult relatives of patients with confirmed HCM) with a non-dilated left ventricle in the absence of another cardiac or systemic disease capable of producing the magnitude of hypertrophy observed.1 ,2 Forty-two patients comprised the final study group. Patients with LV non-compaction (n=2),20 severe hypertension (n=2), previous myocardial infarction (n=2) and cardiac amyloidosis (n=2) were excluded from the analysis (see figure 1). Clinical characteristics were collected through data extraction from medical records.

Flow chart for retrospective analysis in order to compare CMR and ECG parameters in HCM. CMR, cardiac MRI; HCM, hypertrophic cardiomyopathy; LV, left ventricular.
ECG procedure and criteria
A standard 12-lead ECG was obtained in all patients in the supine position during quiet respiration. Cardiac rhythm, PR interval (upper normal limit was 200 ms),14 QRS duration, QRS axis and QT interval duration corrected for cardiac frequency (upper normal limits were 440 ms for men and 460 ms for women)14 were collected. Repolarisation abnormalities were defined as ST depression ≥0.1 mV at 0.08 s from J point, asymmetrical T wave inversion ≥0.1 mV deep in two or more leads except aVR, ST elevation ≥0.2 mV.15 ,21 An abnormal Q wave was determined as described by Konno et al22 by a Q wave >0.3 mV in depth and/or >0.04 s in duration in at least two leads except aVR.19 ,22
We assessed LVH with the Romhilt–Estes score (≥4 for a probable LVH, ≥5 for a definite LVH),23 ,24 the Sokolow–Lyon voltage score (positive for a score ≥3.5 mV),23 ,25 the Sokolow–Lyon product (positive for a score ≥371 mV/ms),26 the Cornell voltage score (≥2.8 mV for men and ≥2 mV for women)27 ,28 and the Cornell product (≥244 mV/ms).
CMR protocol
CMR was performed with a 1.5-T imager (Avanto, Siemens, Erlangen, Germany) by using an eight-element phased-array cardiac receiver coil. Localisation was performed using breath-hold real-time and steady-state free precession images of true anatomical axes of the heart.
Functional parameters were determined with cine imaging using a segmented steady-state free precession pulse sequence in multiple short-axis and four-chamber views covering the entire left ventricle. Typical in-plane resolution was 1.6×1.9 mm, with a section thickness of 7.0 mm (repetition time/echo time: 2.6 ms/1.3 ms; flip angle: 80°; matrix: 256×208; temporal resolution: 35–45 ms).
LGE was performed 12–15 min after gadolinium-based contrast agent administration (cumulative dose, 0.2 mmol/kg of body weight) with a two-dimensional segmented inversion recovery gradient-echo pulse sequence. Typical in-plane resolution was 1.68×1.68 mm; section thickness was 7.0 mm (TE: 4.66 ms; flip angle: 30°; imaging was triggered to every other heartbeat; matrix: 256×208). The inversion time was individually adjusted to null normal myocardium.
Image analysis
All images were analysed at the central core laboratory by two investigators blinded to all patient data and ECG findings. Commercial software (Qmass MR 6.2.1; Leiden, The Netherlands) was used for the analysis. Endocardial and epicardial borders were outlined manually on all end-diastolic and end-systolic short-axis cine slices. LV end-systolic and end-diastolic volumes, LV ejection fraction (EF) and LV mass were then calculated in a standard fashion. The LV maximal wall thickness was automatically measured by the software.
Short-axis slices were divided into four equal parts: septal, anterior, lateral and inferior. The ratio of septal to posterior wall thickness was calculated.19
As described previously,3 the pattern of HCM was defined according to the number of hypertrophied segments in focal HCM (1–2 hypertrophic segments), moderate HCM (3–7 segments) and diffuse HCM (≥8 segments). Then a second classification4 was determined according to the LV mass index (LVMI): normal LVMI (men <81 g/m2, women <62 g/m2), mildly increased LVMI (men 81–91 g/m2, women 62–69 g/m2), markedly increased LVMI (men >91 g/m2, women >69 g/m2). Four-chamber views were used to assess the presence of apical hypertrophy.
LGE was considered to be present (LGE (+) vs LGE (−) groups) when the signal of any area of the myocardium was highly hyperintense in artefact-free images. Semiautomatic quantification of the LGE mass was made using the ‘full width half maximum’ (FWHM) method.29 The extent of LGE was quantified as a percentage of the LV mass.10 ,29 ,30
Statistical analysis
Continuous variables were presented as mean±SD. Categorical variables were given as a number and percentage. Between-group differences were assessed using the Pearson χ2 test or Fisher's exact test (for subgroups containing ≤5 observations) for categorical data and t test for continuous data. Statistical significance was defined as p<0.05 for all tests. Statistical analysis was performed by using SPSS V.15 (SPSS, Inc, Chicago, Illinois, USA).
Results
Clinical characteristics
Forty-two patients were 47±16 years of age, of which 28.5% (n=12) were female (table 1). Family history of HCM and sudden death were, respectively, 31% (n=13) and 15% (n=6), without any difference between the two groups. Seventy-four per cent (n=31) of patients received medical therapy most often by β-blockers (71.8%; n=30) and only one took a calcium antagonist.
Clinical characteristics
ECG characteristics
Sinus rhythm was encountered in 93% of patients (table 2). Repolarisation was normal in 14% of cases (n=6); the most frequent repolarisation abnormalities were ST segment depression in 24 patients (55%) and negative T wave in 32 patients (76%). There was no left bundle branch block.
ECG characteristics
CMR findings
The mean end-diastolic maximal wall thickness was 19.16±3.8 mm, ranging from 13.2 to 27.3 mm (table 3). LGE was found in 25 patients (59.5%). History of hypertension was present in 35% of patients with a trend towards higher rates in patients without LGE (52.9% vs 24%; p=0.056; table 1). Notably, patients with LGE (−) patients presented a higher prevalence of chest pain (47%; n=8) compared to the LGE (+) group (12%; n=3; p=0.015; table 1).
CMR findings
The mean left ventricular mass (LVM) was 141.2±52g in all population without difference between two groups. Similarly, there was no difference concerning LVEF and LV volumes. The ratio of septal to posterior wall thickness was significantly higher in patients with LGE than in those without. No difference was found between LGE (+) and LGE (−) in the HCM pattern and mass distribution. None of the patients had apical hypertrophy on four-chamber views.
The mean wall thickness of LGE (+) segments was 18.2±3.0 mm and each and every LGE (+) segment showed hypertrophy. The LGE extent ranged from 1.3 to 35 g (mean 12±10 g), corresponding to 1–29% (mean 9±8%) of the entire myocardium.
Relationships between ECG and LGE
ECG parameters including conduction disturbances, QRS axis, repolarisation abnormalities and LV hypertrophy scores did not show any difference in patients with or without LGE (table 2).
Patients with LGE showed a greater prevalence of abnormal Q waves (60%; n=15 vs 12%; n=2) than those without (p=0.002; table 2).
However, on segmental analysis, there was no relation between Q waves’ location on ECG and LGE territory (see figure 2). Remarkably, the preferential location of Q waves was DI-aVL, whereas only one patient presented with LGE on the lateral wall (figure 2).
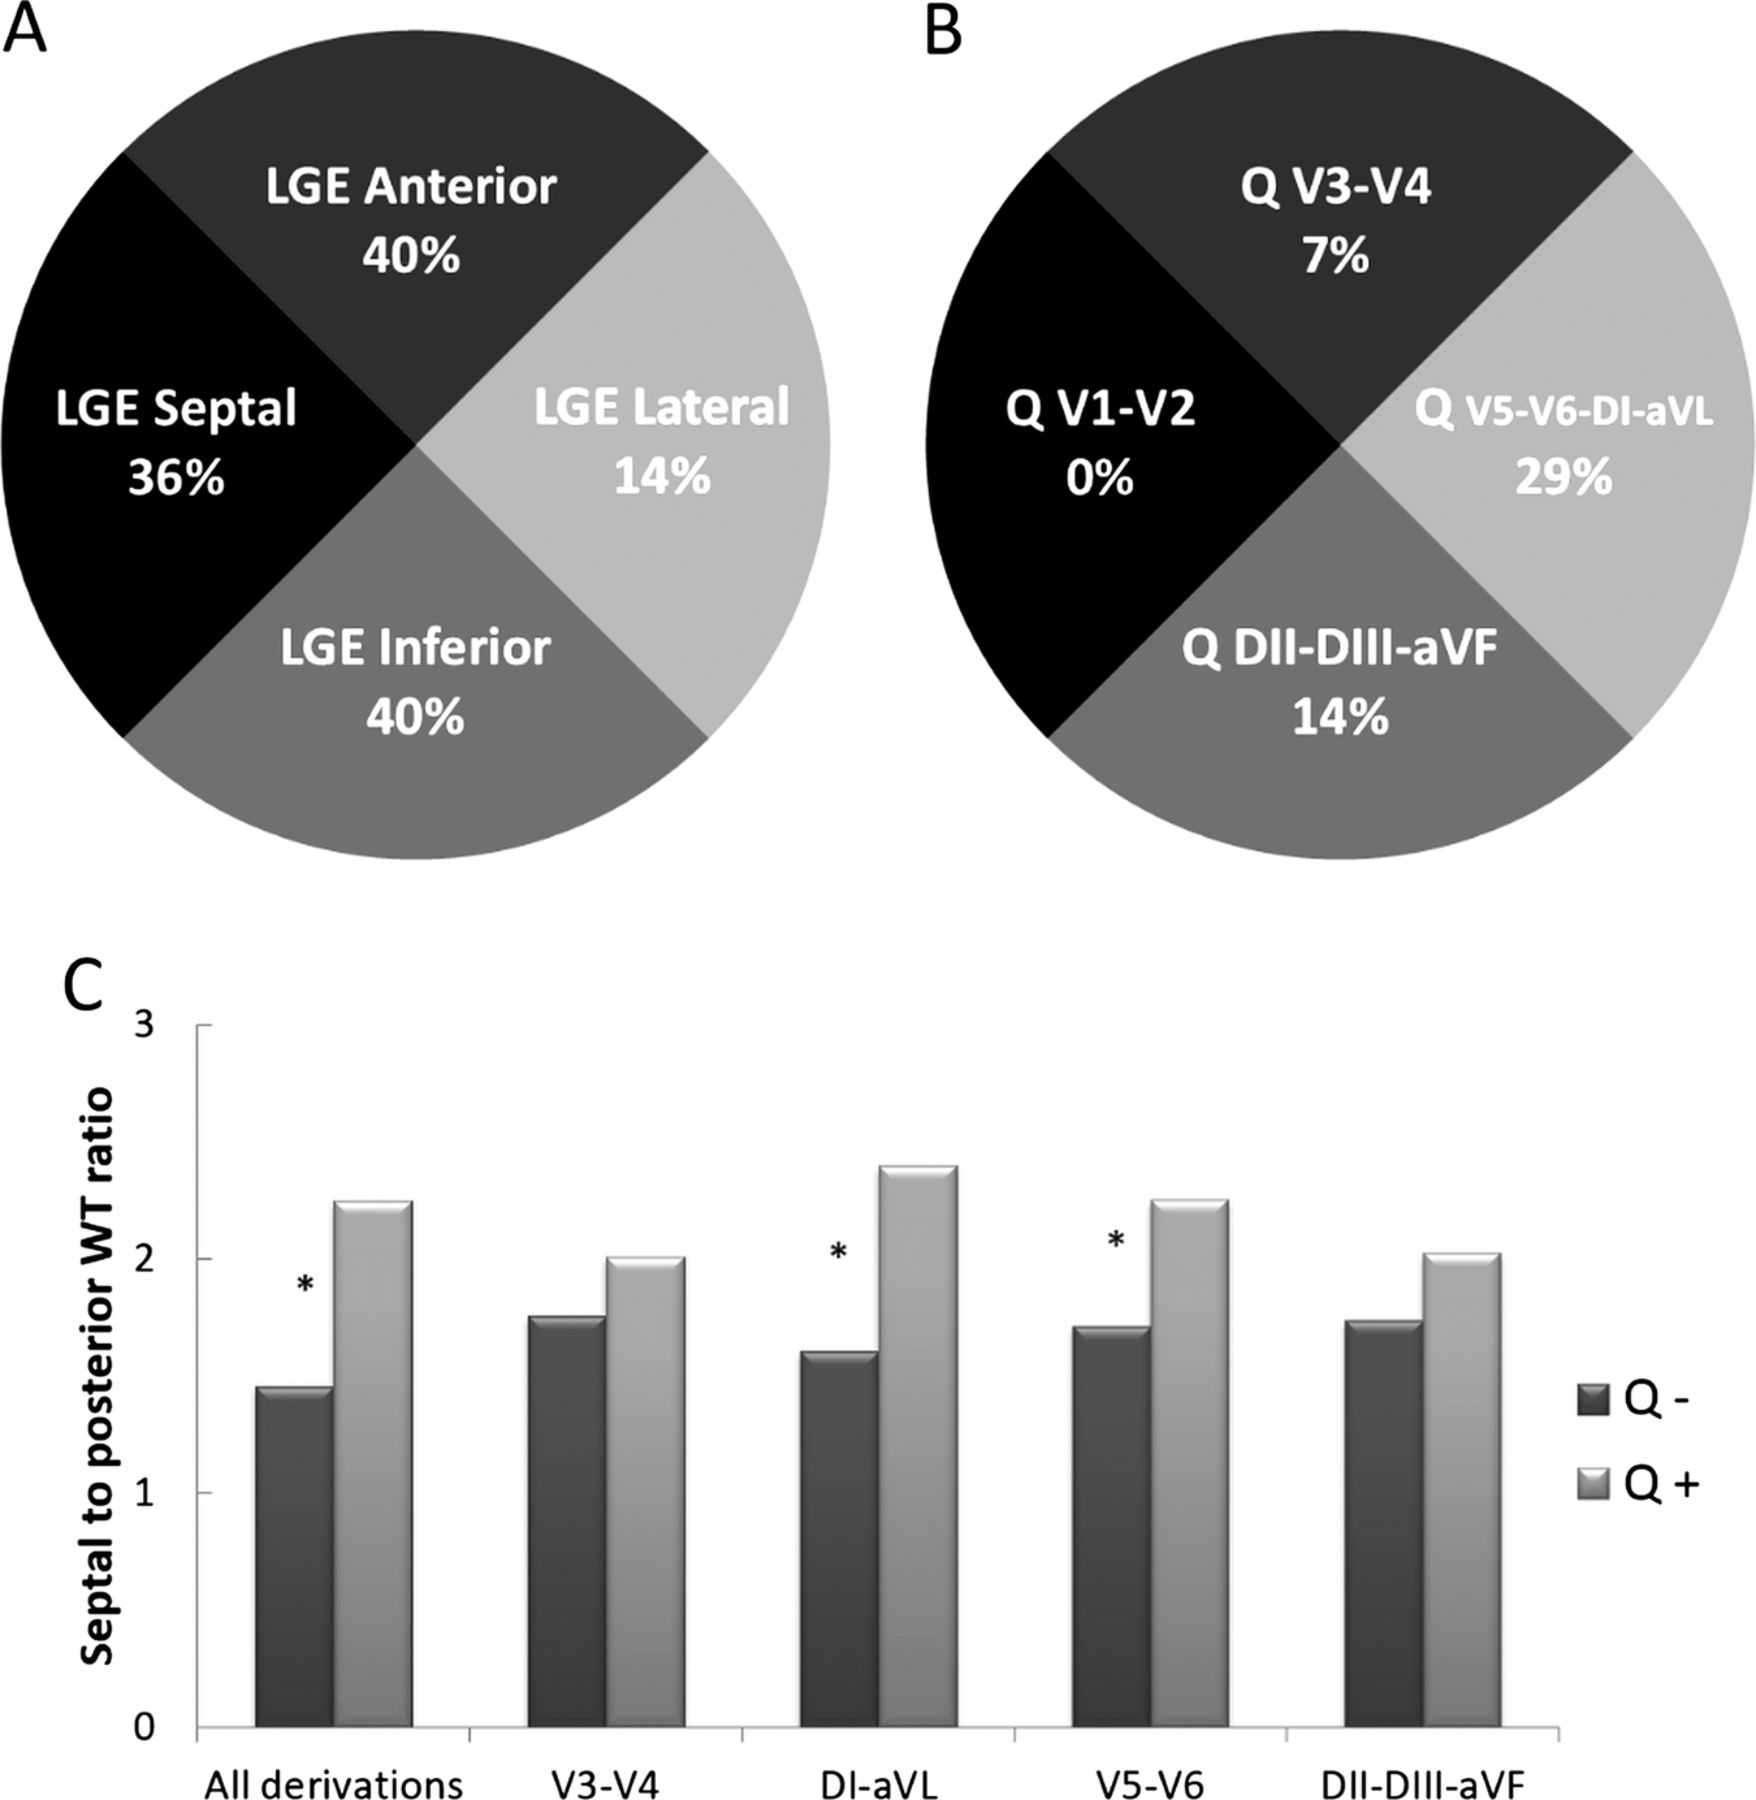
Illustration of discordance between location of Q waves on ECG derivations and location of LGE in the myocardium on CMR. (A) Incidence of LGE within cited location among all patients (n=42). LGE was predominantly on the anterior, septal and inferior territory. (B) Incidence of Q waves in the cited derivations among all patients. Q waves were more likely in the derivations corresponding to the lateral territory. (C) Comparison of septal to posterior WT ratio according to the presence (Q+) or absence (Q−) of Abnormal Q waves in their different derivations. * p<0.05. CMR, cardiac MRI; HCM, hypertrophic cardiomyopathy; LGE, late gadolinium enhancement; WT, wall thickness.
Q waves and quantitative analysis of LGE
Among patients with LGE (n=25; table 4), the LGE extent was similar in patients with or without abnormal Q waves.
Abnormal Q waves and quantitative analysis of LGE
Relationship between septal to posterior wall thickness ratio and abnormal Q waves
Patients with abnormal Q waves had a significantly higher septal to posterior wall thickness ratio (2.2±0.7) compared to those without abnormal Q waves (1.6±0.5; p<0.001; table 4 and figure 2). This difference was also encountered among the subgroup of patients with LGE. Patients with DI-aVL Q waves also had a higher ratio than those without (2.4±0.7 vs 1.6±0.5; p=0.001; figures 2 and 3).
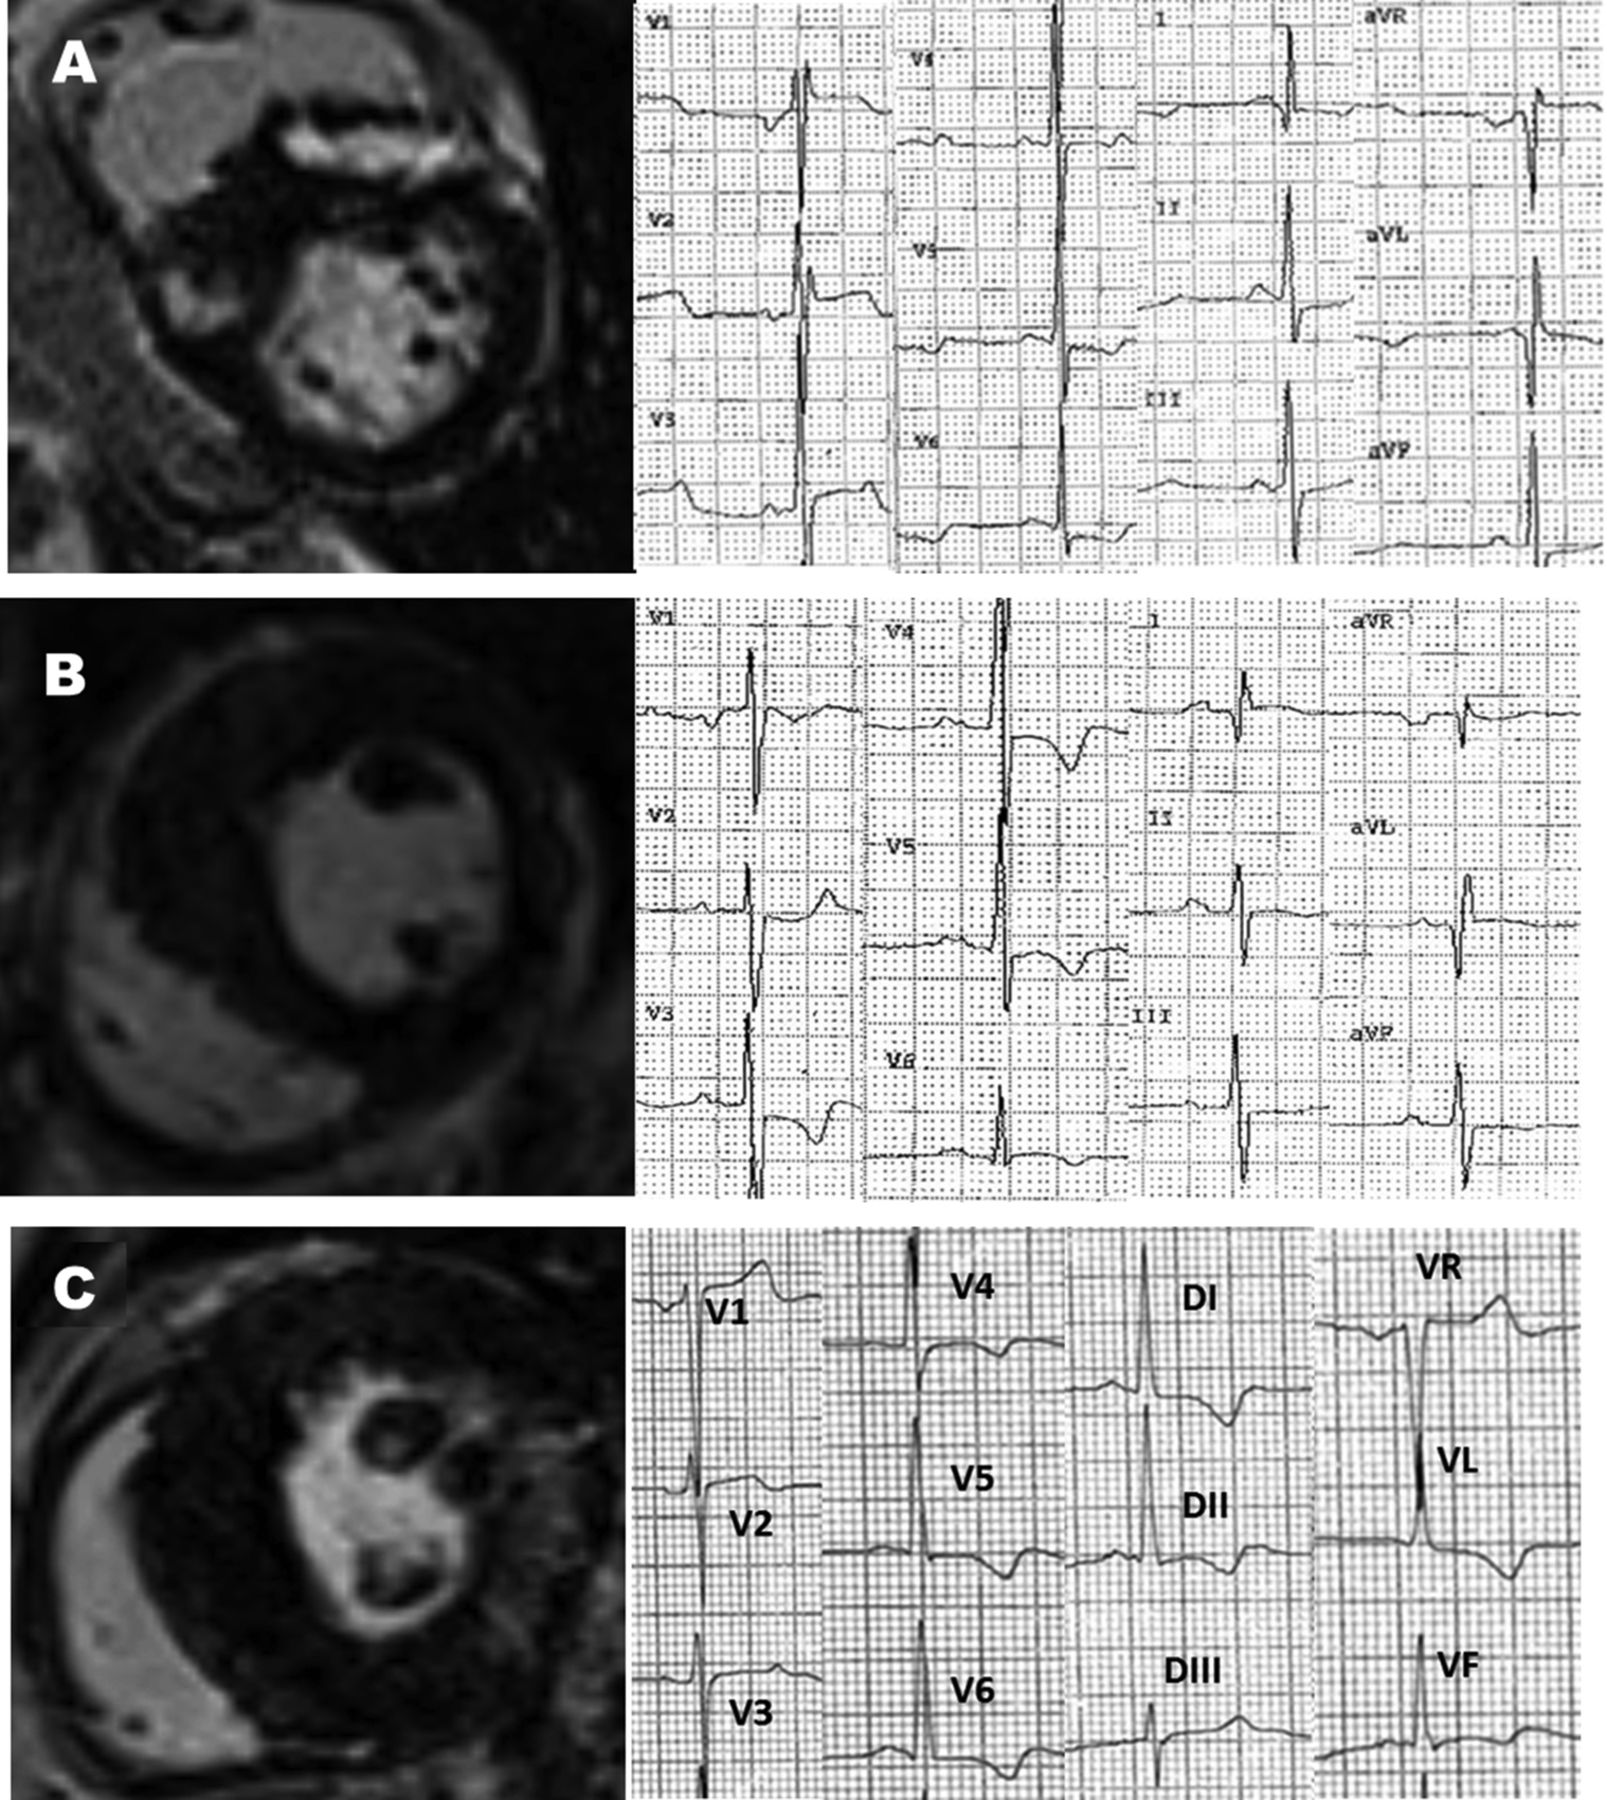
Examples of association between CMR features and abnormal Q waves. (A) HCM with high septal to posterior WT ratio, LGE on right to left ventricular junctions, Q waves in DI-VL discordance between location of Q waves and LGE. (B) Q waves in inferior leads associated with asymmetrical HCM but no LGE. (C) Diffuse HCM with lower septal to posterior WT ratio, LGE in lateral wall but no Q waves. CMR, cardiac MRI; HCM, hypertrophic cardiomyopathy; LGE, late gadolinium enhancement; WT, wall thickness.
Discussion
In the present study, we exhibited that patients with LGE on CMR more often had Q waves on ECG but that the location of LGE in the myocardium was not correlated to the corresponding derivation on ECG. The presence of abnormal Q waves seems to be better related to higher septal to posterior wall thickness than LGE.
LGE was found in 59.5% of the 42 patients. Recent studies considering LGE in HCM showed similar data from 55% to 63%.10 ,31 As previously described, we found a higher prevalence of abnormal Q waves in patients with LGE (+).9 ,10 ,31 We found that 60% of patients with LGE presented with Q waves on the ECG, but the location of Q waves on the ECG was dissimilar to those of LGE on CMR in our study. For example, only one patient with the DI-VL Q wave exhibited lateral LGE. The same result was suggested in the study by Dumont et al18 concerning the predominant location of septal LGE in patients with lateral Q waves. In contrast, Papavassiliu et al19 described a good correspondence between Q waves and LGE though defining only three main territories (anterior, inferior and lateral) corresponding to the coronary arteries32—as a consequence, the interventricular septum was not individualised, although it is a common location of hypertrophy and LGE.18 ,33 Moreover, owing to the high incidence of LGE in the superior and inferior right ventricular insertion points, the American Heart Association 17-segment model was not used for LGE analysis.18 ,32 ,34
Among patients with LGE, those with abnormal Q waves did not present a higher extent of LGE as assessed by a semiautomatic quantitative analysis technique. This result is also different from the study by Papavassiliu et al, because the quantitative analysis was performed by the visual assessment of the transmural nature of LGE and not the absolute LGE extent. To the best of our knowledge, there is no other study on pathologic Q waves and quantitative LGE evaluation. FWHM is a semiautomatic technique to assess LGE mass. Studies demonstrated that FWHM was well correlated with ex-vivo quantification of fibrosis and adverse outcome.10 ,30 In study by Spiewak et al29 there was no difference in mass of LGE assessment with FWHM technique and 6-SD (6- standard deviations) threshold technique when compared to visual planimetry. In this study, FWHM technique had the best reproducibility.
The pathophysiology of abnormal Q waves in HCM is debated and two main hypotheses have been described.35 Q waves in HCM were first correlated with presence of myocardial fibrosis in old necropsy studies.36 Later, Maron et al37 explained Q waves by the loss of local electrical forces secondary to transmural scar. This was again supported in a previous CMR study, but a key role was also given to the distribution of hypertrophy and particularly to the increase of the septal to posterior wall thickness ratio.19 Indeed, abnormal electrical activation of the markedly hypertrophied septum compared to normal posterior wall thickness is another explanation to abnormal Q waves considering several echocardiographic,17 ,38 ECG39 and electrophysiological studies.16 Consistent with this hypothesis, two studies exhibited a disappearance of abnormal Q waves after septal myectomy.40 ,41 In our study, not only was the septal to posterior wall thickness ratio most common in patients with Q waves but also it presented with higher values, even among patients with LGE. This difference was present in segmental analysis considering DI-aVL Q waves, the most frequent Q wave location in our study. Thus, the hypertrophy pattern seems to be predominant in the pathophysiology of Q waves considering the lack of correlation of Q waves with the LGE location and its quantitative analysis.19
The results of this study should be interpreted in the light of certain limitations. First, the retrospective nature of the study may have introduced selection biases. The number of patients is limited and in one single centre compared to some prospective or retrospective studies on HCM,3 ,33 and hypertrophy was mildly severe considering a great number of focal and intermediate patterns as described by Maron et al and few massive septal hypertrophy (≥30 mm) and few LV outflow tract obstructions ≥30 mm Hg. This limit could have biased the characteristics of these patients with HCM.
In addition, diffuse fibrosis was exclusively analysed by LGE and CMR studies including T1 mapping sequences might be of interest to investigate HCM.
Finally, genetic testing was not available for our patients. However, some ECG differences and prognosis impact has been described in line with genetics.42 ,43 Moreover, the monocentric nature of our work may be responsible for the selection of some specific genetic mutations predominantly encountered in our region.
Conclusion
In HCM, it seems that the presence and extent of LGE cannot be presumed by any ECG parameter. Abnormal Q waves on the ECG may be partly attributable to the septal to posterior wall thickness ratio rather than myocardial fibrosis.
References
Footnotes
-
Contributors SG, GC and VM performed CMR analysis. SG and LB contributed to data management. LB, FP, AF and SW were involved in reviewing.
-
Funding This research received no specific grant from any funding agency in the public, commercial or not-for-profit sectors.
-
Competing interests None.
-
Ethics approval Comité d’éthique CHU Angers.
-
Provenance and peer review Not commissioned; externally peer reviewed.
-
Data sharing statement No additional data are available.