Article Text

Abstract
Transcatheter aortic valve replacement (TAVR) has become the preferred therapy for treatment of severe aortic stenosis in patients at intermediate to high risk of perioperative mortality following surgical aortic valve replacement. Haemodynamic assessment is an integral part of the procedure, and it is crucial for the operator to have an in-depth understanding of the haemodynamic alterations that occur during balloon aortic valvuloplasty and transcatheter valve deployment. Comprehension of the haemodynamic tracings is also pivotal for early recognition of periprocedural complications. With expanding indications for TAVR, it is imperative for members of the structural heart team to have an in-depth, nuanced understanding of transcatheter haemodynamic waveforms and their correlation with echocardiographic Doppler waveforms that are obtained periprocedurally during TAVR. This review provides a collection of transcatheter haemodynamic tracings and their corresponding Doppler echocardiography correlates that are demonstrative of physiological alterations and pathological lesions (complications) that occur during TAVR.
- echocardiography
- aortic Valve disease
- percutaneous valve therapy
This is an Open Access article distributed in accordance with the Creative Commons Attribution Non Commercial (CC BY-NC 4.0) license, which permits others to distribute, remix, adapt, build upon this work non-commercially, and license their derivative works on different terms, provided the original work is properly cited and the use is non-commercial. See: http://creativecommons.org/licenses/by-nc/4.0/
Statistics from Altmetric.com
Introduction
Transcatheter aortic valve replacement (TAVR) has become the preferred therapy for treatment of severe aortic stenosis in patients at intermediate to high risk of perioperative mortality following surgical aortic valve replacement.1 The technology has witnessed an exponential adoption rate among operators and is expanding to many hospitals across the USA.2Haemodynamic assessment is an integral part of the procedure, and it is crucial for the operator to have an in-depth understanding of the haemodynamic alterations that occur during balloon aortic valvuloplasty and transcatheter valve deployment. Comprehension of the haemodynamic tracings is also pivotal for early recognition of periprocedural complications. Early recognition of haemodynamic alterations facilitates rapid decision-making in a chronological, stepwise fashion for a successful outcome. This review provides a collection of transcatheter haemodynamic tracings and their corresponding Doppler echocardiography correlates that are demonstrative of physiological alterations and pathological lesions (complications) that occur during TAVR.
Case vignette #1: transcatheter and Doppler waveforms in severe aortic stenosis, pre-transcatheter and post-transcatheter aortic valve replacement
Learning objective
Recognition of classic transcatheter haemodynamic waveforms of the stenotic valve is critical prior to proceeding with TAVR.
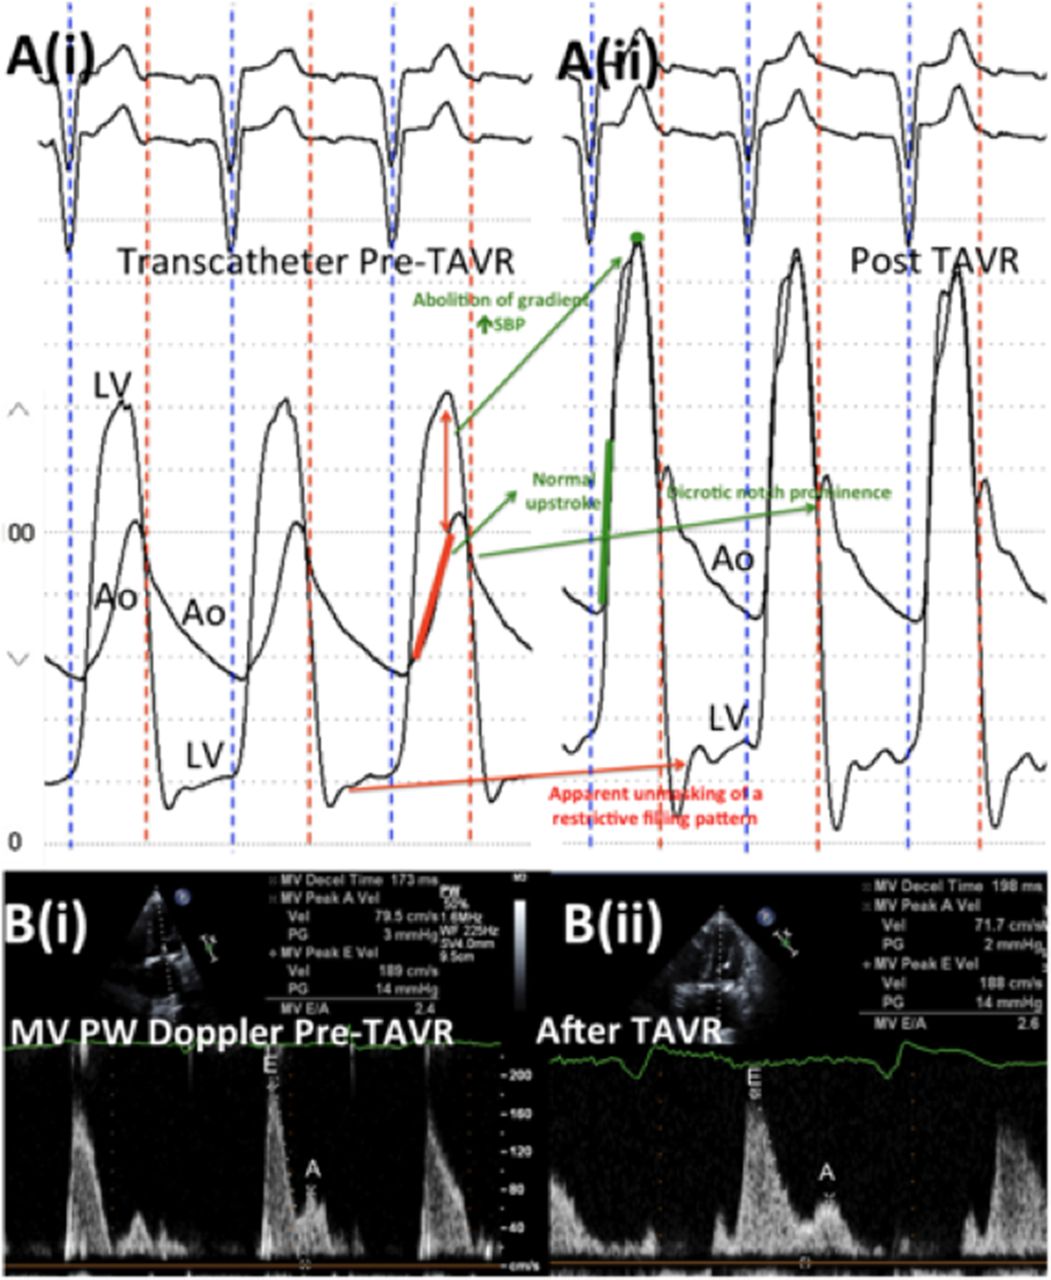
The classical haemodynamic findings of severe aortic stenosis are demonstrated in figure 1—aortic (Ao and left ventricular (LV) pressures obtained from intraprocedural transcatheter tracings (panel (i)) and correlating echocardiographic Doppler waveforms obtained from periprocedural transthoracic echocardiograms (panels (ii–iv)) before (pre, panel A) and after TAVR (post, panel B) are shown. Before TAVR, the large LV–Ao gradient, the slow aortic pressure upstroke (pulsus tardus et parvus; solid red line) and absence of an anacrotic shoulder and dicrotic notch are evident (panel A(i)). After TAVR (right), there is complete resolution of peak instantaneous gradient and peak–peak gradient with recovery of brisk aortic upstroke (solid green line). Both the anacrotic shoulder and dicrotic notch of aortic valve closure have returned (panel B(i)). Corresponding continuous-wave (CW) Doppler waveforms in panel (iv) demonstrate a significant reduction in transaortic gradients post TAVR.
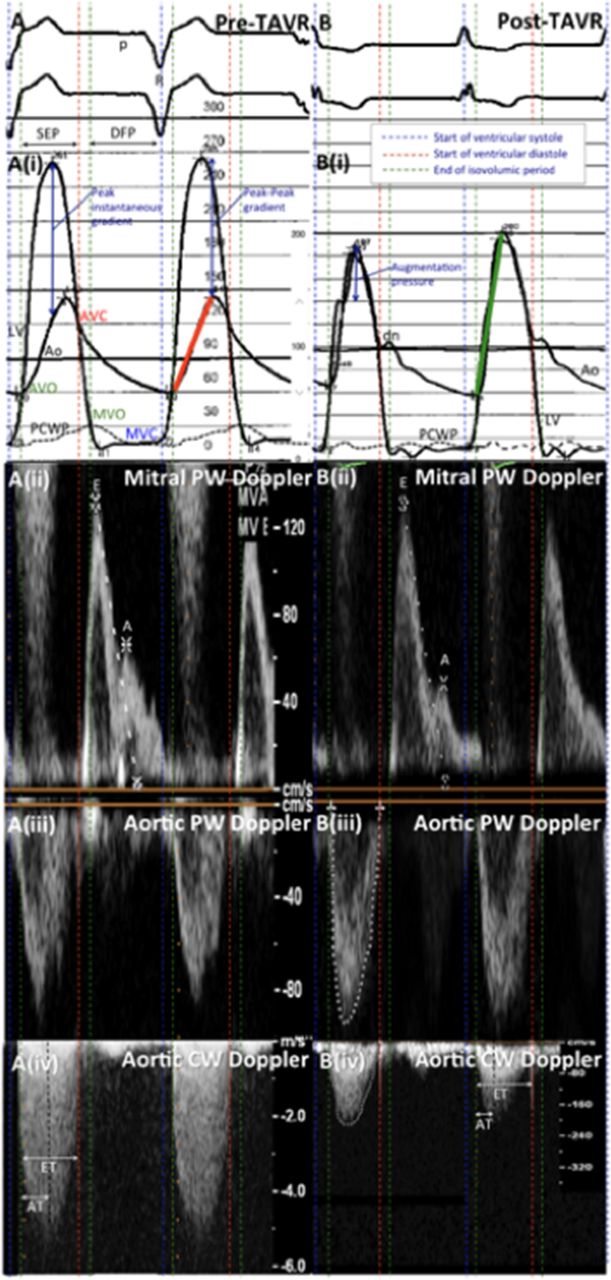
The systolic ejection period (SEP) in panel (i), from the end of isovolumic contraction to the beginning of ventricular diastole, corresponds to the ejection time (ET) in panel (iv). The duration of the aortic upstroke (solid red and green lines in panel (i)) corresponds to the acceleration time (AT) in panel (iv). The diastolic filling period (DFP) in panel (i), from aortic valve closure to mitral valve closure, corresponds to the period between the start of the E wave (early passive filling) to the end of the A wave (atrial contraction) of the mitral inflow Doppler waveforms in panel (ii). The p wave of the ECG corresponds to the A wave in panel (ii), while the R wave corresponds to the onset of ventricular systole, which occurs on mitral valve closure (blue dashed line). Panel (ii): pulse-wave (PW) Doppler at the tip of the mitral leaflets; panel (iii): PW Doppler in the left ventricular outflow tract; panel (iv): CW Doppler across the aortic valve. AVC, aortic valve closure; AVO, aortic valve opening; MVC, mitral valve closure; MVO, mitral valve opening; PCWP, pulmonary capillary wedge pressure; TAVR, transcatheter aortic valve replacement.
Case vignette #2: mixed aortic stenosis and regurgitation before and after TAVR
Learning objective
In this vignette, transcatheter haemodynamic findings associated with mixed aortic stenosis and regurgitation are reviewed.
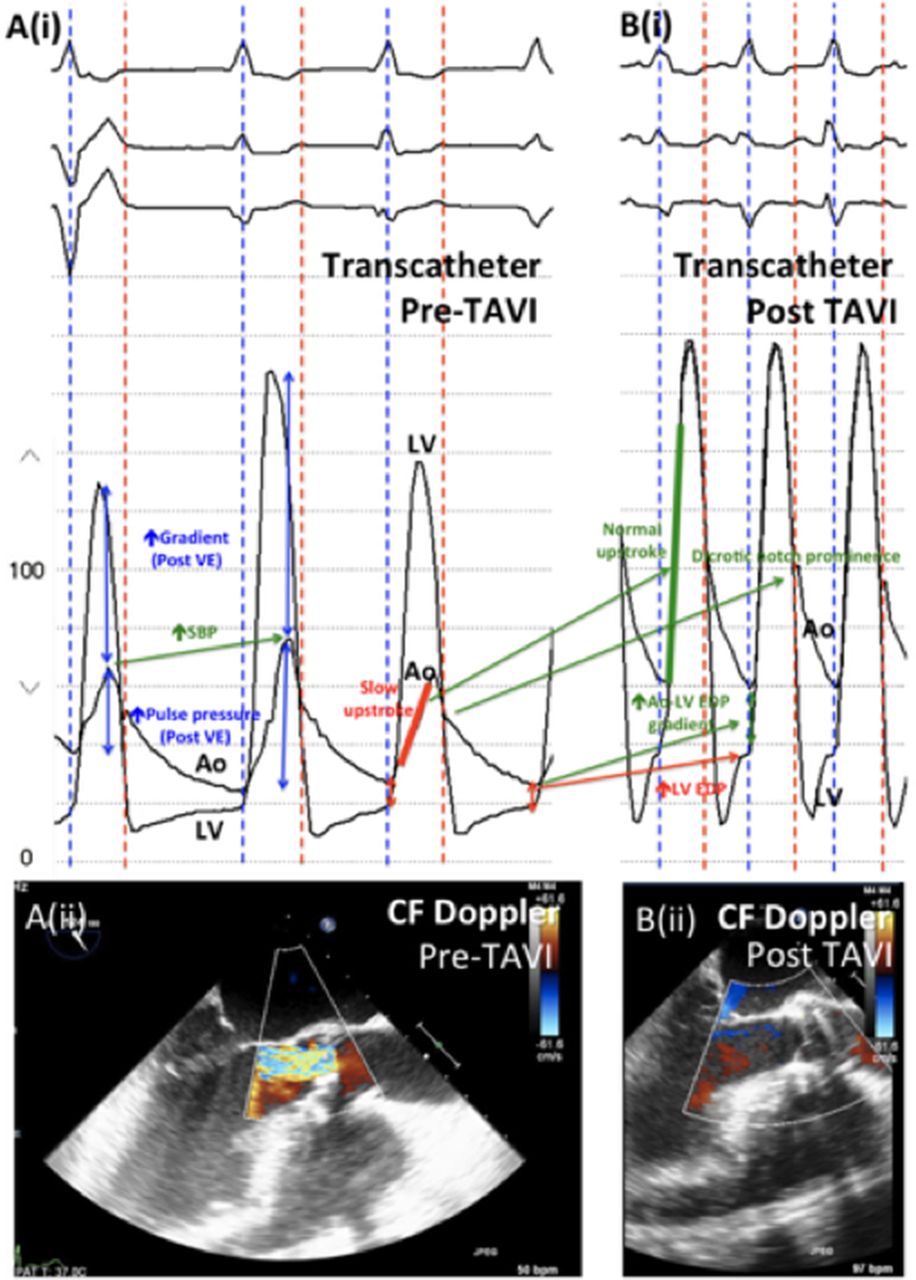
Figure 2, panel A(i), demonstrates a large LV–Ao gradient and an increased pulse pressure, especially evident following a ventricular ectopic (VE) beat in severe aortic stenosis. Panel A also demonstrates severe aortic regurgitation, suggested by low aortic diastolic pressure, wide pulse pressure and low Ao diastolic–LV end-diastolic pressure (LVEDP) gradient. This lesion is confirmed on a transoesophageal echocardiogram (TEE) (panel A(ii)). As demonstrated in figure 1, amelioration of aortic stenosis following TAVR is shown by resolution of LV–Ao gradients, brisk arterial upstroke (solid green line) and return of the dicrotic notch following TAVR (panel B). The increased aortic diastolic pressure and Ao diastolic–LVEDP gradient, and the presence of a dicrotic notch suggest amelioration of aortic regurgitation, which is clearly demonstrable on TEE (panel B(ii)). Despite no evidence of significant aortic regurgitation post TAVR, there is a persistent wide pulse pressure. A rise in LVEDP is noted, which is likely due to increased heart rate and blood pressure, compared with that due to aortic regurgitation or perivalvular leak.

Ao, aorta; CF, color-flow; LV, left ventricle; LV EDP, left ventricular end-diastolic pressure; SBP, systolic blood pressure; TAVI, transcatheter aortic valve implantation; VE, ventricular ectopic.
Case vignette #3: pressure recovery, and mixed aortic stenosis and regurgitation
Learning objective
In severe aortic stenosis, maximal transvalvular gradient is recorded at the level of the vena contracta.3 This measurement is difficult to obtain accurately by cardiac catheterisation as it is cumbersome to position and maintain the pressure transducer at the level of the vena contracta. Cardiac catheterisation measures transvalvular pressure downstream to the vena contracta, where part of the jet kinetic energy is recovered.3 This pressure recovery (maximal transvalvular gradient—net transvalvular gradient) results in a lower transvalvular gradient compared with maximal transvalvular gradient measured by Doppler echocardiography. Pressure recovery is dependent on the valve effective orifice area and aortic cross-sectional area.3This vignette demonstrates the phenomenon of pressure recovery in severe aortic stenosis.
Figure 3 demonstrates the phenomenon of pressure recovery in severe aortic stenosis (panels A (auto-phase correction ‘on’) and B (auto-phase correction ‘off’))—simultaneous femoral artery (Fem) waveforms are higher than aortic (Ao) waveforms recorded just distal to the stenosed aortic valve. Pressure recovery is more common in patients with small aortas, as demonstrated on cardiac CT scan (panel C). Panels D (pre-TAVR) and E (post-TAVR) show transcatheter waveforms (panel (i)) and color-flow Doppler TEE images (panel (ii)) of the aortic valve in long and short axes. There is severe mixed aortic stenosis and regurgitation, which is ameliorated following TAVR (panel E). A ‘reverse’ LV-femoral arterial gradient in panel E is attributable to pressure recovery.
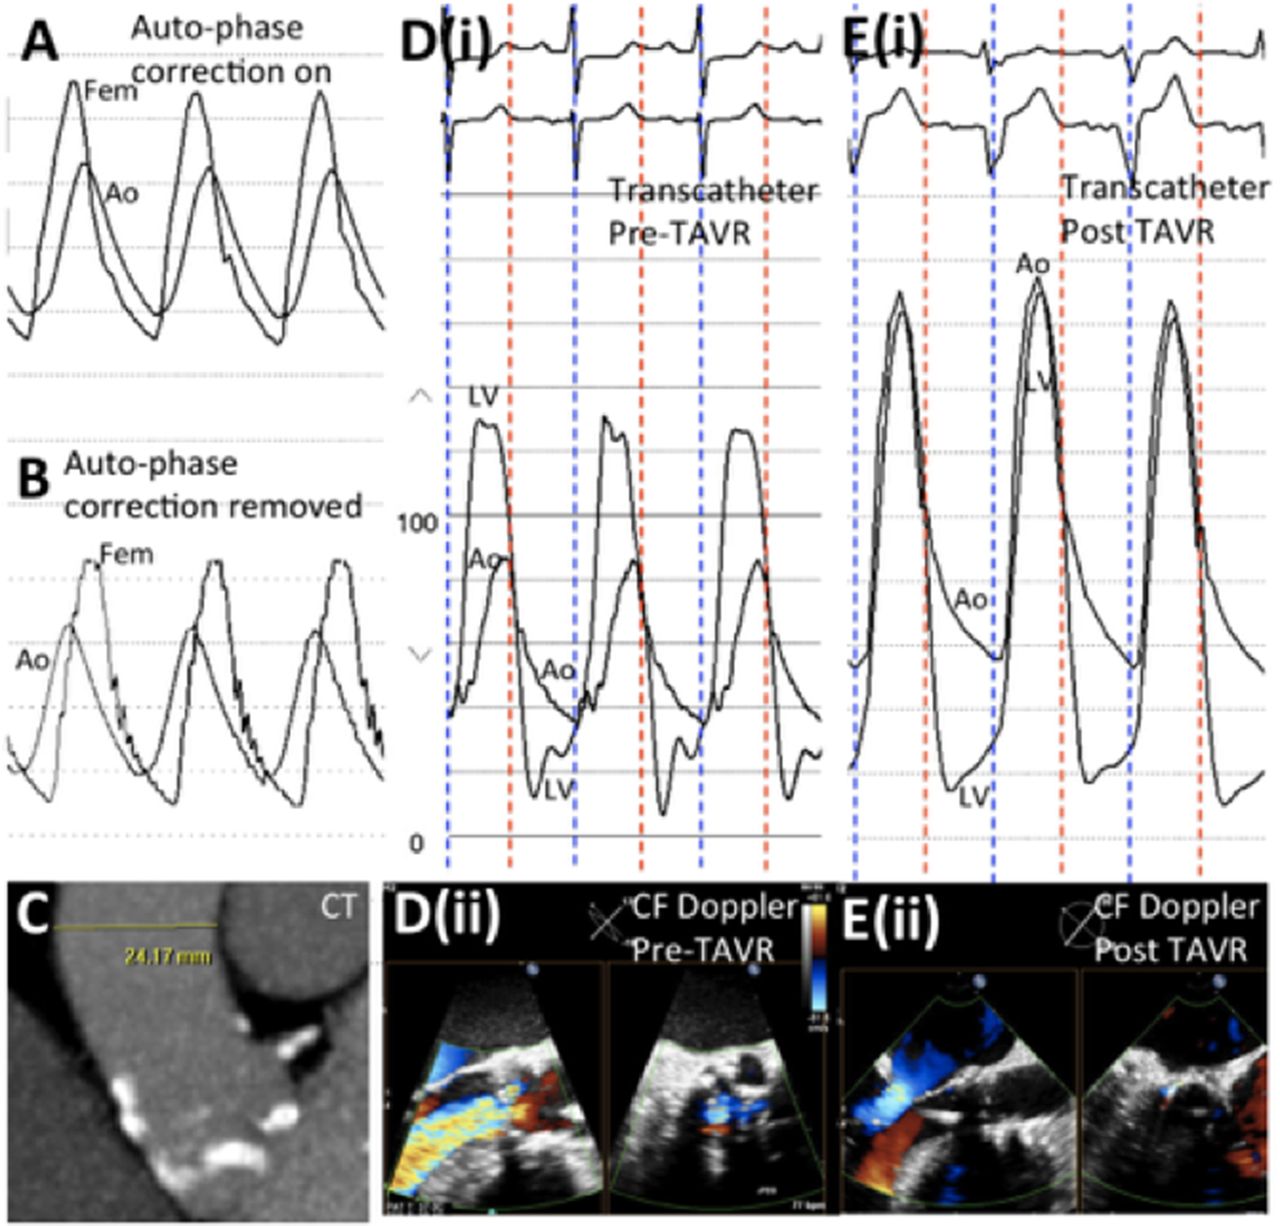
Ao, aorta; CF, color-flow; Fem, femoral artery; LV, left ventricle; TAVR, transcatheter aortic valve replacement.
The following three case vignettes describe peri-TAVR aortic regurgitation (central and paravalvular) that occur immediately following deployment of the transcatheter valve. As demonstrated by these cases, accurate interpretation of the haemodynamic waveforms is key in making the correct diagnosis, and subsequent clinical decision-making and management.
Case vignette #4: perivalvular aortic regurgitation and its response to temporary pacing after TAVR
Learning objective
Identification of acute severe aortic insufficiency after TAVR, and its response to temporary pacing.
The management of severe regurgitation after TAVR presents only a few limited options. Depending on the proximate cause, one can dilate the valve to achieve optimal expansion and contact between the prosthesis and aortic annulus, use a perivalvular plug, implant another valve (valve-in-valve) or use pacing at rates of 75–85 beats/min to decrease the diastolic time interval and hope for a reduction in aortic regurgitation as self-expanding valves expand or as tissue ingrowth occurs into valve skirts. Figure 4 demonstrates transcatheter haemodynamics before (panel A(i)) and after (panel A(ii)) TAVR (with heart block-related bradycardia). There is significant aortic regurgitation immediately following TAVR. Within minutes following right ventricular pacing (panel C(iii)), aortic regurgitation is reduced with resolution of rapid filling over diastasis, increased diastolic pressure and end-diastolic LV–Ao gradient, and drop in LVEDP demonstrating the reduction in significant aortic regurgitation. Peri-TAVR color-flow Doppler in the long-axis and short-axis views (panels B and C, respectively), and PW Doppler (panel D) echocardiography, all demonstrate varying degrees of aortic regurgitation following rapid right ventricular pacing.

Ao, aorta; AR, aortic regurgitation; CFD, color-flow Doppler; LV, left ventricle; LV EDP, left ventricular end-diastolic pressure; PW, pulse-wave; TAVR, transcatheter aortic valve replacement.
Case vignette #5: severe aortic regurgitation following TAVR for low-flow, low-gradient aortic stenosis
Learning objective
Identification of acute severe aortic insufficiency after TAVR and understanding the different mechanisms of aortic insufficiency post TAVR.
In patients with reduced LV ejection fraction and low transaortic gradient, dobutamine stress echocardiography can be used to confirm the presence of severe aortic stenosis (panels A(i)–A(iii)), further demonstrated by transcatheter (B) and color-flow Doppler assessment (C) before TAVR (i) (figure 5). Immediately after TAVR (ii), severe central aortic regurgitation was observed with characteristic haemodynamic waveforms showing near matching of LV and aortic pressure with equilibration over diastole, resulting in end-diastolic pressure matching. The severe aortic regurgitation was treated with placement of a second valve prosthesis (valve-in-valve TAVR) (iii), reducing aortic regurgitation to trivial central aortic regurgitation and restoring optimal haemodynamic function with a low LV outflow tract (LVOT) gradient on CW Doppler (panel E(iii)). There is evidence of native left coronary leaflet overhang seen posteriorly (C(ii), asterisk, right panel, on the long-axis view), although aortic regurgitation appears to originate from failure of closure of the bioprosthetic anterior leaflet (C(i), left panel, short-axis view). Supporting evidence from transcatheter haemodynamics (panel B(ii)) of severe aortic regurgitation immediately post TAVR is the significant diastolic flow reversal seen using CW Doppler of the descending aorta (panel D(i)), which is ameliorated after valve-in-valve TAVR (panel D(ii)). An accurate assessment of post-TAVR corrected effective orifice area (CEOA) includes PW Doppler sampling (yellow squares in far-right panels) in the LVOT before (panel E(i)) rather than after (panel E(ii)) flow convergence, and CW Doppler sampling (panel E(iii)) perpendicular to flow (yellow rectangle in far-right panel). The vignette depicts one of the mechanisms of aortic regurgitation post TAVR (central aortic regurgitation). Different mechanisms of aortic regurgitation post TAVR include prosthesis failure or misplacement (too low or too high), or annular calcification not allowing good valve skirt apposition.4
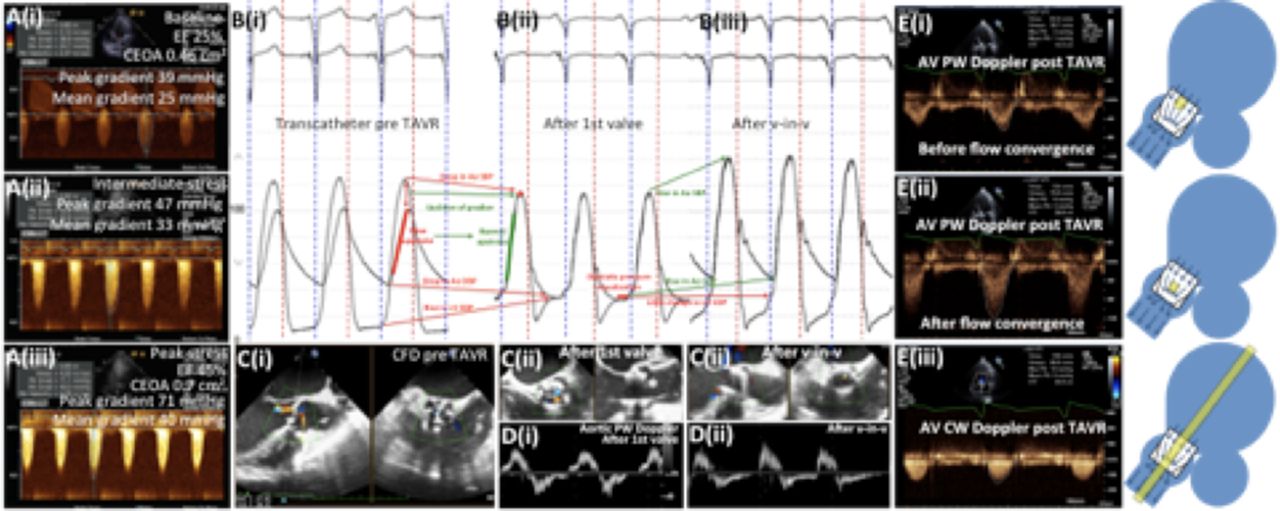
Ao, aorta; CEOA, corrected effective orifice area; CFD, color-flow Doppler; CW, continuous-wave; DBP, diastolic blood pressure; LV EDP, left ventricular end-diastolic pressure; PW, pulse-wave; SBP, systolic blood pressure; TAVR, transcatheter aortic valve replacement; v-in-v, valve-in-valve.
Case vignette #6: paravalvular aortic regurgitation following TAVR
Learning objective
Transcatheter and Doppler waveform correlation for accurate recognition of severity of post-TAVR aortic regurgitation.
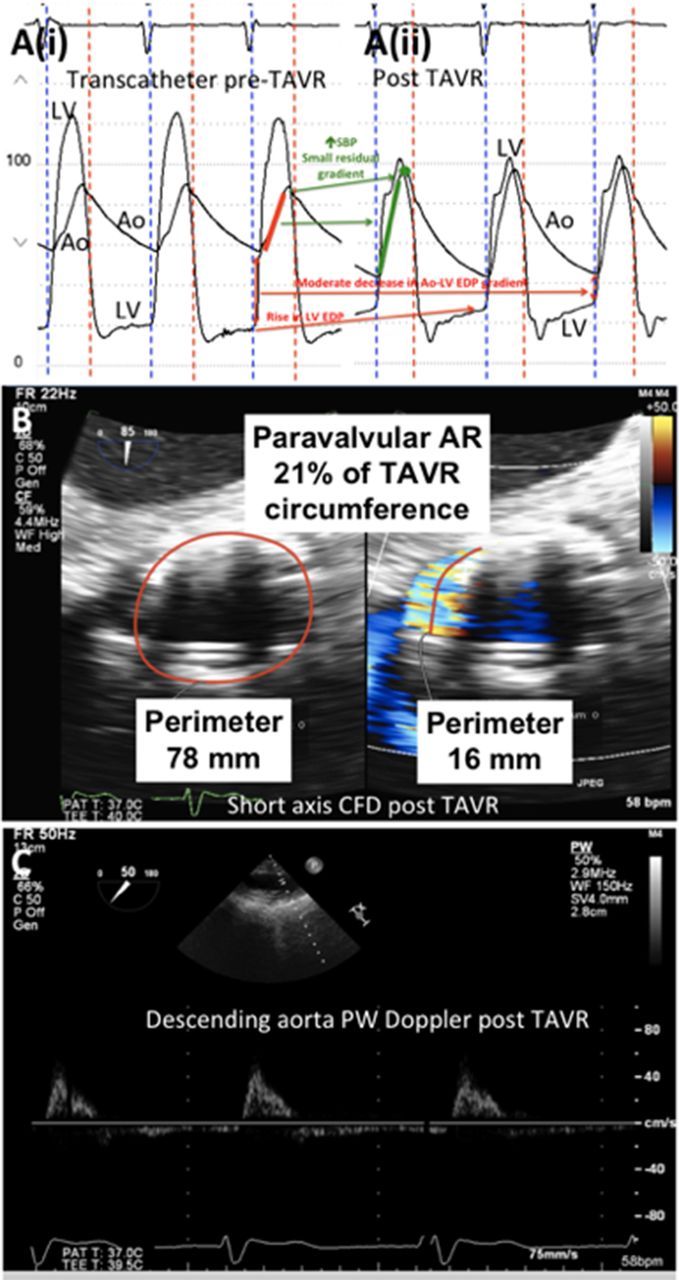
Given the calcific and slit-like orifice of many aortic valves, and the configuration and distortion of the aortic orifice after balloon valvuloplasty, it is not unexpected that the circular stented valve would not be able to seal all the perivalvular crevices associated with perivalvular leaks. Figure 6 demonstrates transcatheter haemodynamics before (panel A(i)) and after (panel A(ii)) TAVR. The post-TAVR haemodynamics are consistent with moderate rather than severe aortic regurgitation. Color-flow Doppler in short-axis view after TAVR (panel B) demonstrates paraprosthetic aortic regurgitation, with the circumferential extent >20%, suggestive of severe aortic insufficiency (by American Society of Echocardiography/Valve Academic Research Consortium criteria). However, a CW Doppler in the descending aorta post TAVR (panel C) with little diastolic flow reversal is supportive of only mild aortic regurgitation. Presence of any degree of periprosthetic aortic regurgitation has been independently associated with mortality risk at 1 year.5 Calculation of the aortic regurgitation index (ratio of gradient between diastolic blood pressure and LVEDP to systolic blood pressure) provides a powerful prognostic assessment of the severity of aortic regurgitation.6 In a study of 146 patients undergoing TAVR with self-expanding CoreValve (Medtronic, Minneapolis, Minnesota, USA), aortic regurgitation index <25 independently predicted 1-year mortality, compared with an index >25 (46.0% vs 16.7%; P<0.001; HR 2.9, 95% CI 1.3 to 6.4; P=0.009).6 When there is discrepancy with regard to the severity of aortic regurgitation, aortic root angiography should be performed to assess for its severity, and balloon postdilation to expand fully the aortic prosthesis should be strongly considered if there is more than mild residual periprosthetic aortic regurgitation. Balloon postdilation for management of paravalvular leak post TAVR portends a risk of annular rupture. The decision to postdilate should be carefully weighed against the risk of rupture, taking into consideration the presence of bulging nodules of calcium and overall degree of calcification of the annulus and outflow tract.7

Ao, aorta; AR, aortic regurgitation; CFD, color-flow Doppler; LV, left ventricle; LV EDP, left ventricular end-diastolic pressure; PW, pulse-wave; SBP, systolic blood pressure; TAVR, transcatheter aortic valve replacement.
The following two case vignettes describe peri-TAVR mitral valve lesions that occur immediately following deployment of the transcatheter valve. As demonstrated by these cases, accurate interpretation of the haemodynamic waveforms is key in making the correct diagnosis, and subsequent clinical decision-making and management.
Case vignette #7: mitral regurgitation following TAVR
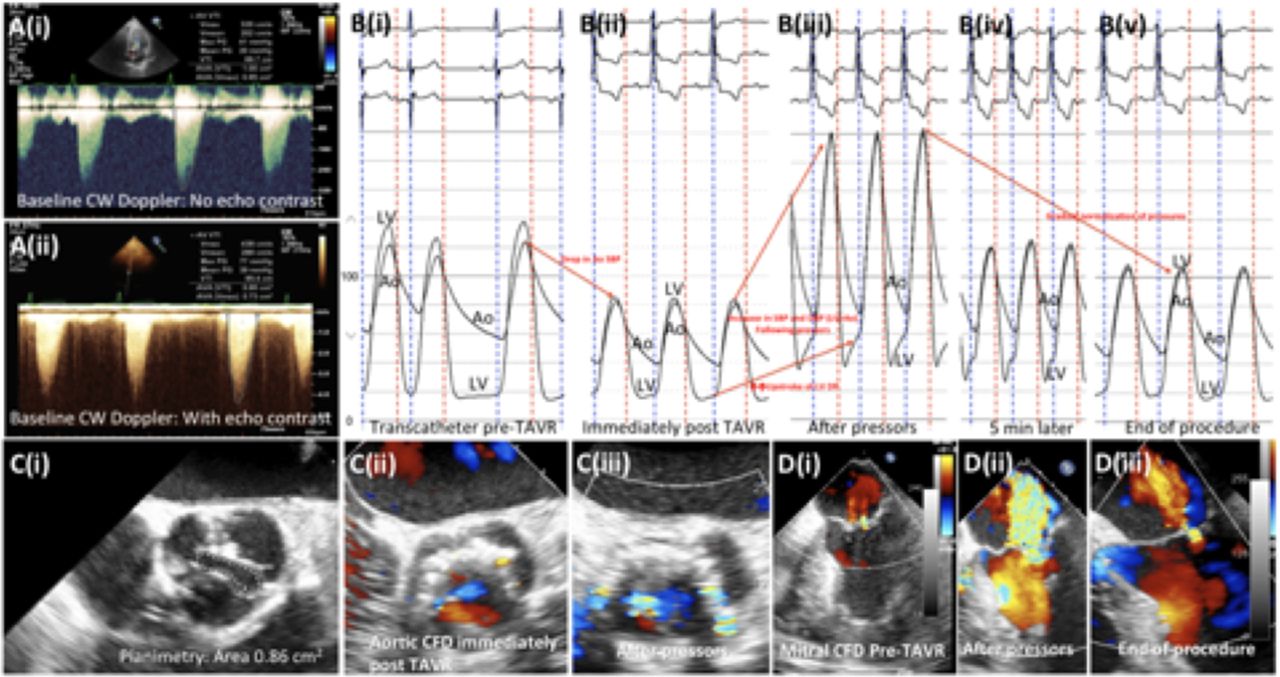
Mechanisms of mitral regurgitation following TAVR include stent interference with the mitral leaflets, catheter/wire disruption of the mitral valve apparatus or acute LV dilation with papillary muscle dysfunction. This vignette demonstrates changes in severity of mitral regurgitation with fluctuation in systemic blood pressure prior to and following vasopressor administration. Figure 7 demonstrates CW Doppler waveforms with (panel A(i)) and without (panel A(ii)) echocardiographic contrast agent use, and a short-axis TEE (panel C(i)) confirming severe aortic stenosis. There is a precipitous drop in blood pressure immediately after valve implantation (likely due to rapid pacing during valve deployment) (panel B(ii)) that responds appropriately to vasopressor administration (panel B(iii))—note the change in the upstroke of LV end-diastolic pressure tracing following pressor administration. The TEE demonstrates severe mitral regurgitation during vasopressor administration (panel D(ii)) that resolves at the end of the procedure with gradual normalisation of blood pressure, and termination of vasopressor support (panels B(iv)–(v) and D(iii)).

Ao, aorta; CFD, color-flow Doppler; CW, continuous-wave; LV, left ventricle; LV EDP, left ventricular end-diastolic pressure; SBP, systolic blood pressure; TAVR, transcatheter aortic valve replacement.
Case vignette #8: mitral regurgitation following TAVR due to systolic anterior motion of the anterior mitral leaflet
Learning objective
Recognition of systolic anterior motion of the anterior mitral leaflet, and its appropriate management post TAVR.
Figure 8 demonstrates transcatheter haemodynamic findings pre TAVR (panel A(i)) and post TAVR (panel A(ii)). Color-flow Doppler echocardiographic findings at baseline (panel B), post TAVR (panel C), and at the end of the procedure (panel D), in systole (panel (i)) and diastole (panel (ii)) demonstrate increased contractility of a bulky interventricular septum following relief of aortic stenosis post TAVR, leading to systolic anterior motion of the anterior mitral leaflet (green arrow in panel C(i)). Severe mitral regurgitation due to systolic anterior motion of the anterior mitral leaflet responds appropriately to increased preload (fluid-loading) (panel D(i)). Anatomic risk factors for this complication include severe LV hypertrophy or a sigmoid septum that can be identified on preprocedure echocardiogram or CT scan. However, not all cases respond to increased preload and may require alcohol septal ablation.8
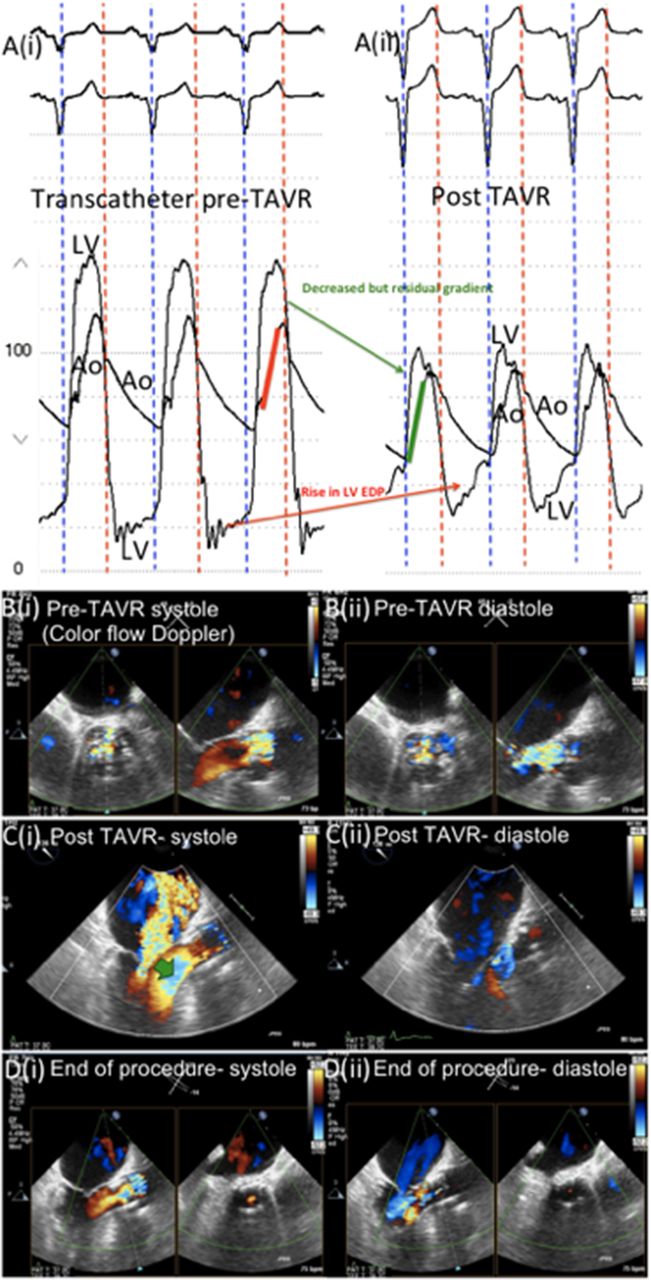
Ao, aorta; LV, left ventricle; LV EDP, left ventricular end-diastolic pressure; TAVR, transcatheter aortic valve replacement.
The following two case vignettes highlight associated diastolic dysfunction that occurs in patients with severe aortic stenosis, and discrepancies in transcatheter and Doppler waveforms for peri-TAVR assessment of diastolic function.
Case vignette #9: diastolic dysfunction in TAVR
Patients with aortic stenosis have LV hypertrophy and diastolic dysfunction, often overshadowed by the severity of the LVOT obstruction. Once the outflow obstruction is relieved, the diastolic dysfunction can become manifest and unmasked for all to see. Figure 9 demonstrates transcatheter (A) and transmitral Doppler (B) assessment of diastolic function before (i) and after (ii) TAVR. Before TAVR, the LV diastolic waveform has a normal-appearing filling pattern with LVEDP of 20 mm Hg. After TAVR, there is an elevated plateau of diastolic pressure with a new appearance of an early dip consistent with a restrictive filling pattern (panel A(ii)). Scrutiny of the transmitral Doppler, pre TAVR (panel B(i)) and post TAVR (panel (ii)) shows no change from baseline evaluation with high E/A ratios pre TAVR and post TAVR.
Ao, aorta; LV, left ventricle; PW, pulse-wave; SBP, systolic blood pressure; TAVR, transcatheter aortic valve replacement.
Case vignette #10; peri-TAVR diastolic dysfunction and aortic regurgitation after temporary pacing
Learning objective
Assessment of peri-TAVR diastolic function and its differentiation from aortic regurgitation.
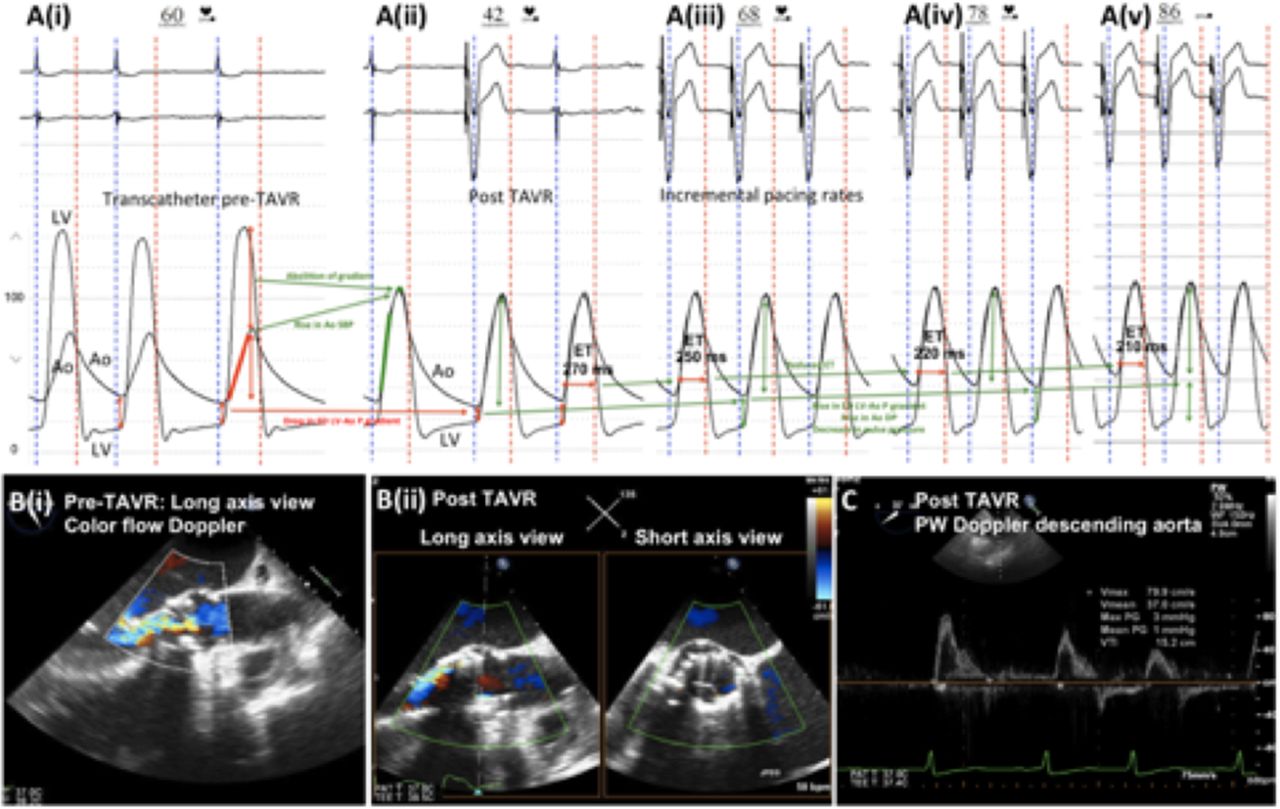
Various degrees of diastolic dysfunction and aortic regurgitation can occur after TAVR, which can be addressed by temporary pacing. Figure 10 demonstrates transcatheter haemodynamics (panel A) and color-flow Doppler echocardiography in long-axis views (panel B) pre TAVR (panel (i)) and post TAVR (panel (ii)). Transcatheter (panel A(i)) and Doppler echocardiography (panel B(i)) findings before TAVR are both suggestive of moderate–severe aortic regurgitation. Despite mild aortic regurgitation after TAVR as seen on color-flow Doppler echocardiography (panel B(ii)) and confirmed by the absence of significant flow reversal (panel C), the haemodynamics after TAVR (panel A(ii)) are of moderate–severe aortic regurgitation with a low diastolic pressure and end-diastolic LV–Ao gradient, although there is a lack of rise in LV end-diastolic pressure. Incremental right ventricular pacing rate (panel A(iii)–(v)) shortens the ejection time (ET) and increases the aortic diastolic pressure without changing the LV end-diastolic pressure. Pacing permits stabilisation and time to consider aetiologies and management options.

Ao, aorta; ET, ejection time; LV, left ventricle; PW, pulse-wave; TAVR, transcatheter aortic valve replacement.
Conclusion
With expanding indications for TAVR leading to a burgeoning TAVR-eligible population and an increase in structural heart programmes nationally, it is imperative for members of the structural heart team (interventionalists and interventional echocardiographers) to have an in-depth, nuanced understanding of transcatheter haemodynamic waveforms and their correlation with echocardiographic Doppler waveforms that are obtained periprocedurally during TAVR. As demonstrated by the case vignettes, accurate and timely interpretation of transcatheter haemodynamic waveforms is the fulcrum on which the successful management of peri-TAVR haemodynamic alterations and complications is balanced. Moreover, a nuanced interpretation of transcatheter haemodynamic waveforms reinforces the appreciation of the physiological and engineering marvel of the human heart.
Footnotes
Competing interests DLB: Advisory Board: Cardax, Elsevier Practice Update Cardiology, Medscape Cardiology, Regado Biosciences; Board of Directors: Boston VA Research Institute, Society of Cardiovascular Patient Care; Chair: American Heart Association Quality Oversight Committee; Data Monitoring Committees:Cleveland Clinic, Duke Clinical Research Institute, Harvard Clinical Research Institute (including for serving as DMC Chair for the PORTICO trial funded by St. Jude, now Abbott), Mayo Clinic, Mount Sinai School of Medicine, Population Health Research Institute; Honoraria: American College of Cardiology (Senior Associate Editor, Clinical Trials and News, ACC.org), Belvoir Publications (Editor in Chief, Harvard Heart Letter), Duke Clinical Research Institute (clinical trial steering committees), Harvard Clinical Research Institute (clinical trial steering committee), HMP Communications (Editor in Chief, Journal of Invasive Cardiology), Journal of the American College of Cardiology (Guest Editor; Associate Editor), Population Health Research Institute (clinical trial steering committee), Slack Publications (Chief Medical Editor, Cardiology Today’s Intervention), Society of Cardiovascular Patient Care (Secretary/Treasurer), Web MD (CME steering committees); Other: Clinical Cardiology (Deputy Editor), NCDR-ACTION Registry Steering Committee (Chair), VA CART Research and Publications Committee(Chair); Research Funding: Amarin, Amgen, Astra Zeneca, Bristol-Myers Squibb, Chiesi, Eisai, Ethicon, Forest Laboratories, Ironwood,Ischemix, Lilly, Medtronic, Pfizer, Roche, Sanofi Aventis, The Medicines Company; Royalties: Elsevier (Editor, Cardiovascular Intervention: A Companion to Braunwald’s Heart Disease); Site Co-Investigator: Biotronik, Boston Scientific, St. Jude Medical (now Abbott); Trustee: American College of Cardiology; Unfunded Research: Flow Co, Merck, PLx Pharma, Takeda. MJR reports a personal fees from Medtronic, Inc.
Patient consent Obtained.
Provenance and peer review Not commissioned; internally peer reviewed.
Data sharing statement No additional data are available.