Article Text

Abstract
Objectives Identifying high-risk patients is crucial for effective cardiovascular disease (CVD) prevention. It is not known whether electronic health record (EHR)-based machine-learning (ML) models can improve CVD risk stratification compared with a secondary prevention risk score developed from randomised clinical trials (Thrombolysis in Myocardial Infarction Risk Score for Secondary Prevention, TRS 2°P).
Methods We identified patients with CVD in a large health system, including atherosclerotic CVD (ASCVD), split into 80% training and 20% test sets. A rich set of EHR patient features was extracted. ML models were trained to estimate 5-year CVD event risk (random forests (RF), gradient-boosted machines (GBM), extreme gradient-boosted models (XGBoost), logistic regression with an L2 penalty and L1 penalty (Lasso)). ML models and TRS 2°P were evaluated by the area under the receiver operating characteristic curve (AUC).
Results The cohort included 32 192 patients (median age 74 years, with 46% female, 63% non-Hispanic white and 12% Asian patients and 23 475 patients with ASCVD). There were 4010 events over 5 years of follow-up. ML models demonstrated good overall performance; XGBoost demonstrated AUC 0.70 (95% CI 0.68 to 0.71) in the full CVD cohort and AUC 0.71 (95% CI 0.69 to 0.73) in patients with ASCVD, with comparable performance by GBM, RF and Lasso. TRS 2°P performed poorly in all CVD (AUC 0.51, 95% CI 0.50 to 0.53) and ASCVD (AUC 0.50, 95% CI 0.48 to 0.52) patients. ML identified nontraditional predictive variables including education level and primary care visits.
Conclusions In a multiethnic real-world population, EHR-based ML approaches significantly improved CVD risk stratification for secondary prevention.
- electronic health records
- coronary artery disease
- risk factors
Data availability statement
No data are available. The data analysed during the current study are not publicly available. Due to reasonable privacy and security concerns, the underlying EHR data are not easily redistributable to researchers other than those engaged in the Institutional Review Board-approved research collaborations in the current project. The corresponding author may be contacted for access to EHR data for an IRB approved collaboration.
This is an open access article distributed in accordance with the Creative Commons Attribution Non Commercial (CC BY-NC 4.0) license, which permits others to distribute, remix, adapt, build upon this work non-commercially, and license their derivative works on different terms, provided the original work is properly cited, appropriate credit is given, any changes made indicated, and the use is non-commercial. See: http://creativecommons.org/licenses/by-nc/4.0/.
Statistics from Altmetric.com
Key questions
What is already known about this subject?
Patients with established cardiovascular disease (CVD) are at high risk for a recurrent event. Identifying high-risk patients can help guide and intensify preventive therapy. It is not known whether electronic health record (EHR)-based machine learning (ML) models can improve CVD risk stratification compared with the Thrombolysis in Myocardial Infarction Risk Score for Secondary Prevention Risk Score for Secondary Prevention (TRS 2°P) developed from clinical trials.
What does this study add?
In a multiethnic secondary prevention population, various EHR-based ML models significantly outperformed TRS 2°P for risk stratification for CVD events. The use of a rich patient feature set from the EHR was more important than model choice.
How might this impact on clinical practice?
For secondary prevention, EHR-based ML approaches may be used to improve risk stratification and targeted treatment intensification.
Introduction
In patients with established cardiovascular disease (CVD), secondary prevention strategies aim to minimise recurrent CVD events including myocardial infarction (MI), stroke and death.1 Despite the use of first-line therapies, patients with established CVD remain at elevated risk for recurrent CVD events.2 Identifying high-risk patients is crucial to guide treatment intensification and personalisation, including with add-on therapies such as advanced lipid-lowering agents or novel antidiabetic agents.3 4 However, our ability to risk-stratify patients is limited by a paucity of validated predictive algorithms for secondary prevention.5 6 The Pooled Cohort Equations (PCEs) are used widely to predict atherosclerotic CVD (ASCVD) risk and guide statin therapy for primary prevention, but are not recommended for those with established CVD or those on statin therapy.7 8 Previously proposed models such as the Thrombolysis in Myocardial Infarction Risk Score for Secondary Prevention (TRS 2°P) were also developed and validated in clinical trial cohorts leading to unclear applicability to diverse real-world CVD populations.9
Machine learning (ML) can help develop broadly applicable risk stratification models for real world settings by leveraging datasets such as electronic health records (EHRs) and identifying variables and relationships between variables that may not be identified by traditional models.10 11 ML models have demonstrated significant promise for risk stratification in medicine across various populations, including for cardiovascular risk.10–13 To address the risk stratification gap for secondary prevention, we aimed to develop and evaluate supervised EHR-trained ML models to stratify CVD event risk compared with TRS 2°P in a multiethnic secondary prevention cohort for CVD risk stratification.
Methods
Patient and public involvement
Patients and/or the public were not involved in the design, or conduct, or reporting, or dissemination plans of this research.
Study cohort
The study cohort included adults with established CVD who were over 18 years of age who received care from a large, community-based Northern California health system between 1 January 2009 and 31 December 2018. Patients were required to have at least two outpatient visits that were at least 1 year apart and were excluded if they had less than 5 years of total follow-up and did not have an outcome event. The index date was defined as the first outpatient visit that was 1 year after the first clinic visit. If there were no cholesterol lab results before a patient’s index date, the index date was shifted to the date of the first cholesterol lab result. Established CVD was defined as per the 2013 American College of Cardiology/American Heart Association (ACC/AHA) Guideline on the Assessment of Cardiovascular Risk including prior MI, stroke, coronary revascularisation procedures, atrial fibrillation, congestive heart failure or coronary artery disease or equivalents.8 The subcohort of patients with (ASCVD: coronary artery disease, cerebrovascular disease, peripheral arterial disease, polyvascular disease (two or more ASCVD conditions)) was identified.
Patient variables
Prior CVD conditions were identified by the International Classification of Diseases, 9th and 10th Revision, Clinical Modification (ICD-9-CM/ICD-10-CM) coding scheme (online supplemental table 1). Patients on statins were identified by the first two digits of generic product identifier codes 39. Variables included in the modified TRS 2°P score were extracted (namely, age ≥75 years, diabetes, hypertension, current smoking, peripheral artery disease, prior stroke, prior coronary artery bypass grafting (CABG), history of heart failure, renal dysfunction (estimated glomerular filtration rate <60 mL/min/1.73 m2 by the MDRD formula), and history of MI).9 Age at index date was not available for patients whose age at the end of the study period (2018) was 89 years or greater, because the precise index age of these specific patients was deidentified in the database to protect privacy. For total cholesterol, HDL cholesterol, systolic blood pressure and smoking status, the most recent value on or before the index date was used. The most recent height, weight and diastolic blood pressure measurements before each patient’s index date were also included. Diabetes status was identified by either a diagnosis of diabetes (ICD-9-CM: 250.*; ICD-10-CM: E11*, Z79.4, Z79.84) or a diabetes medication (GPI2: 27) prescribed on or prior to index date. On the date of the patient’s blood pressure measurement, the use of antihypertensive medications (GPI codes beginning with 33, 34, 36, 37, 4013 or 4016) was assessed. Missing race was inferred based on the Social Security Record database as previously described.14
Supplemental material
Additional patient variables were selected a priori based on EHR availability and relevance to CVD. Variables were grouped into socioeconomic, clinical and healthcare utilisation categories and extracted 1 year prior to the index date. Medical conditions were extracted from the EHR problem list coded in ICD-9-CM/ICD-10-CM and grouped into 283 categories using the Clinical Classification Software (CCS).15 Self-reported family (parents or sibling) medical histories were extracted. CCS and family history conditions were coded as binary variables. Medication prescription information was obtained by using the first four digits of prescriptions’ GPI codes (GPI4). An indicator was created for each GPI4 denoting whether any medication from that GPI4 was prescribed. The total number of medication prescriptions in the prior year was included as a variable. Two indicator variables were included for each lab test: whether the test was ordered and returned a ‘normal’ result, and whether it was ordered and returned an ‘abnormal’ result. The total number of laboratory tests ordered and the total number which returned ‘abnormal’ results were included. Socioeconomic variables were derived from patient addresses and included census block group level indicators of educational attainment and median household income. In addition, the number of primary care, urgent care, specialty and other (eg, ancillary) service care visits in the previous year were included as healthcare utilisation variables.
Outcome
A CVD event was defined as the first acute MI, stroke, or fatal coronary artery disease per ACC/AHA guidelines after the index date.8 Acute MI was defined by ICD-9-CM codes 410.* and ICD-10-CM codes I21.*, I22.*, I23.3, I24.0, I24.9, I25.9, or I51.3.12 13 Stroke events were defined based on ICD-9-CM codes 430.*, 431.*, 432.*, 433.*1, 434.*1 or 436.0 and ICD-10-CM codes G46.*, I63.*, I67.85, I69.30, I77.89, P91.0, or Z86.73.14 Fatal coronary artery disease was defined by the presence of an ICD-9-CM code 411.*, 413.*, or 414.* or an ICD-10-CM code I20.*, I23.7, I24.*, I25.*, or T82.85 code, followed by death within a year. Follow-up was right censored after a CVD event, an unrelated death, or after 5 years of event-free follow-up, whichever came first. Death information was retrieved from EHR and Social Security record data.
ML model development
ML model training and testing was performed in all patients with CVD and was repeated in the subcohort of patients with ASCVD. For ML model training and testing, the cohort was first randomly split into an 80% training/validation set and a 20% held-out test set stratified by outcome. Rather than arbitrarily choose a single ML model, we trained and tested several supervised ML algorithms as per accepted practice: random forests (RF), gradient boosted machines (GBM), extreme gradient boosted models (XGBoost) and logistic regression with the standard L2 penalty (LR) and with an L1 lasso penalty (LASSO).11
For the training and cross-validation pipeline, ML algorithms were given variables as inputs and to predict whether a patient would have a CVD event in the following 5 years. For each ML algorithm, fivefold cross-validation was used on the training set to tune hyperparameters, such as tree depth, learning rate and number of trees. Hyperparameters used and values for those hyperparameters are shown in online supplemental table 2 and a grid search approach was used for the hyperparameter tuning phase. Models were compared based on the mean area under the receiver operating characteristic curve (AUC), also known as the C-statistic, across the fivefold. Additionally, 95% AUC CIs were also calculated.16 Feature importance was reported using the F-score, a measure which represents the fraction of times a given feature was used to split the data across all trees. Missing variables were imputed using Bayesian ridge estimators applied iteratively in order of ascending percentage variable missingness, and the mean posterior value was used as the imputed value. For each step of the cross-validation pipeline, the training/validation set was split into prespecified training (64%) and held-out cross-validation (16%) folds. The best-performing cross-validated models were retrained on the entire training set.
ML model testing
The final performance of the best-performing ML models including AUC with 95% CIs, sensitivity, specificity, precision and F1-score were reported and evaluated on the 20% held-out test set. TRS 2°P-based CVD risk in the test set was calculated based on assigning 1 point to the presence of each included clinical variable, as previously described.9 Analyses were performed in Python V.3.7 using the scikit-learn and XGBoost packages, V.0.21.2 and V.0.90, respectively.17
Results
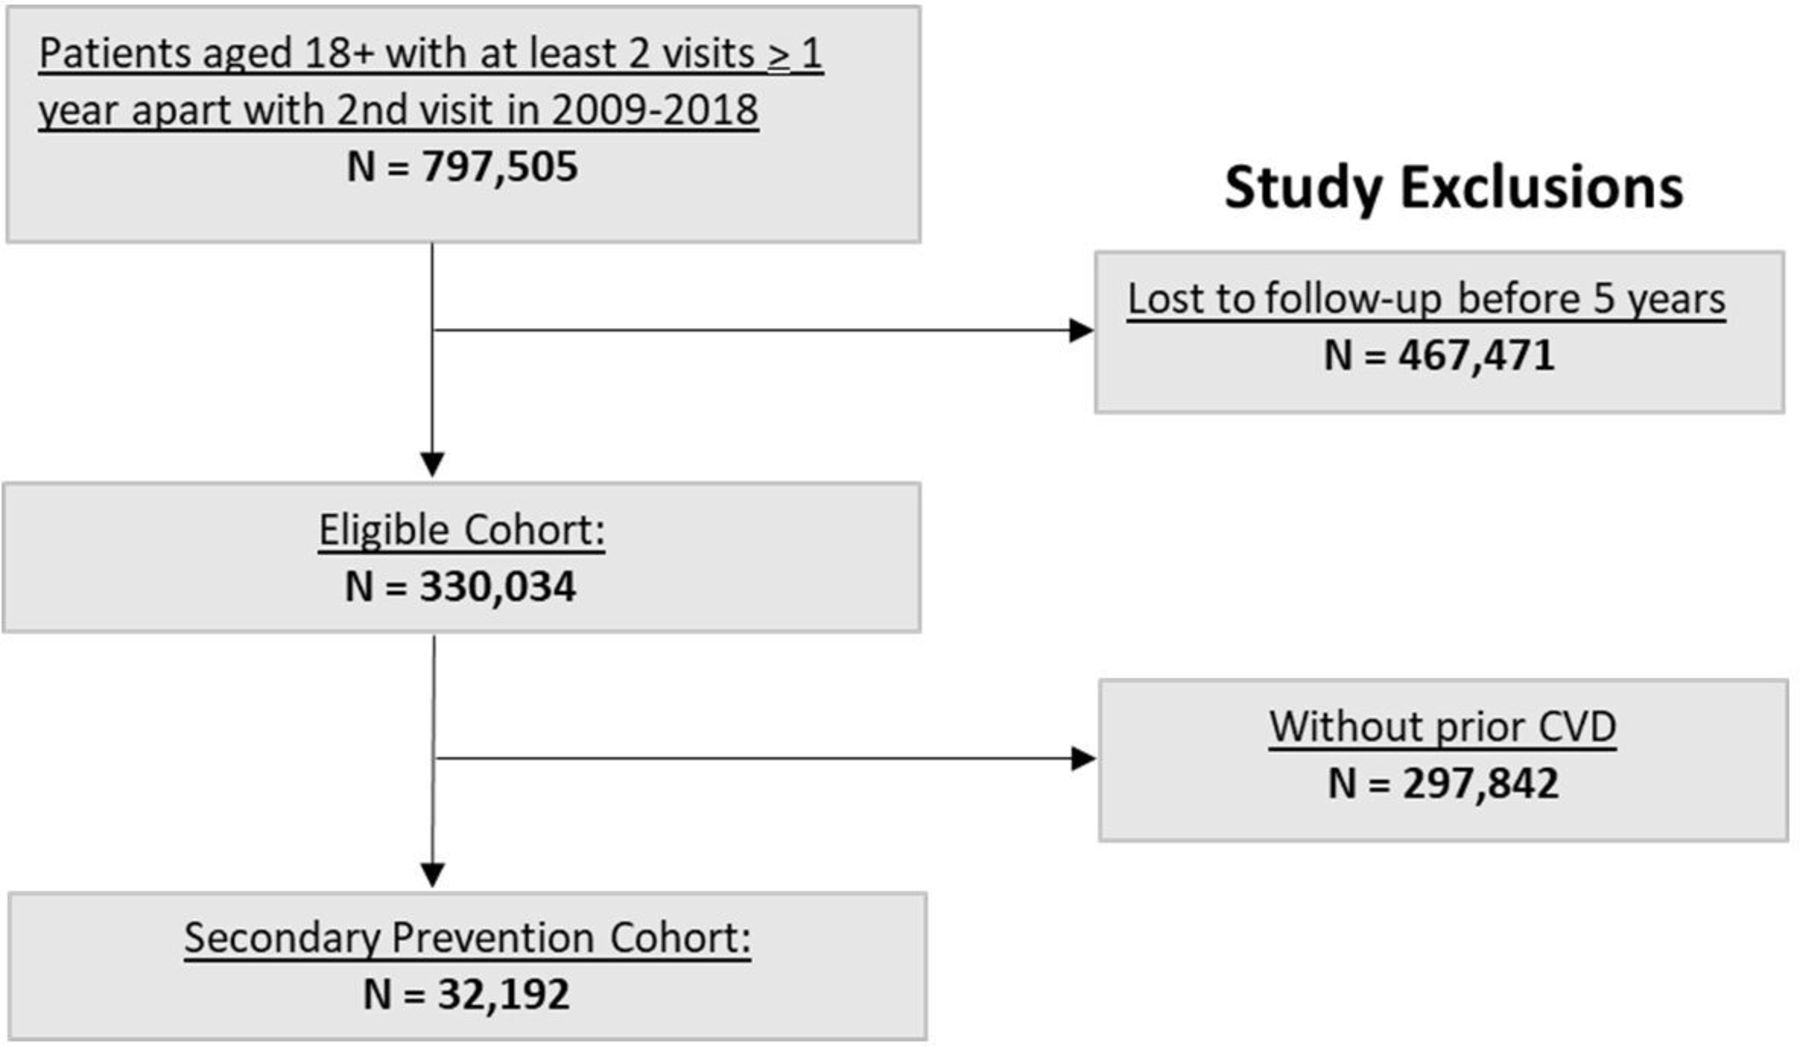
The study cohort consisted of 32 192 patients with prior CVD, with a median age of 74 years, and with 46% female, 63% non-Hispanic white, 12% Asian and 6% Hispanic patients (figure 1; table 1). A total of 23 475 patients (72.9%) had ASCVD and 15 724 (49%) were on statin therapy. A total of 12 821 patients had available variables to calculate a TRS 2°P score. During 5 years of follow-up, 4010 patients (12.5%) experienced a CVD event. There were 123 EHR variables selected for use in the final models (out of 1181 variables initially considered), including 37 medication binary values (by GPI4), 21 binary laboratory values, 3 health utilisation variables (number of primary, specialty and other care visits), 32 comorbidity variables, 1 family history variable and 7 socioeconomic status variables (median household income and variables representing six levels of education). These variables are outlined in online supplemental list 1. The missingness of the variables is shown in online supplemental table 3.

CONSORT diagram. *Patients with an outcome event (CVD event or death) within the 5 years follow-up window were not excluded. †Pre‐existing cardiovascular disease (or CVD) was defined by the following International Classification of Diseases, ninth Revision, Clinical Modification (ICD‐9‐CM) codes: atrial fibrillation: 427.31; heart failure: 428*; coronary artery disease: 411*, 413*, 414*; myocardial infarction; 410*; and stroke: 430–434*, 436* (refer to online supplemental table 1). CONSORT, Consolidated Standards of Reporting Trials; CVD, cardiovascular disease.
Baseline characteristics of study cohort stratified by presence or absence of an outcome CVD event
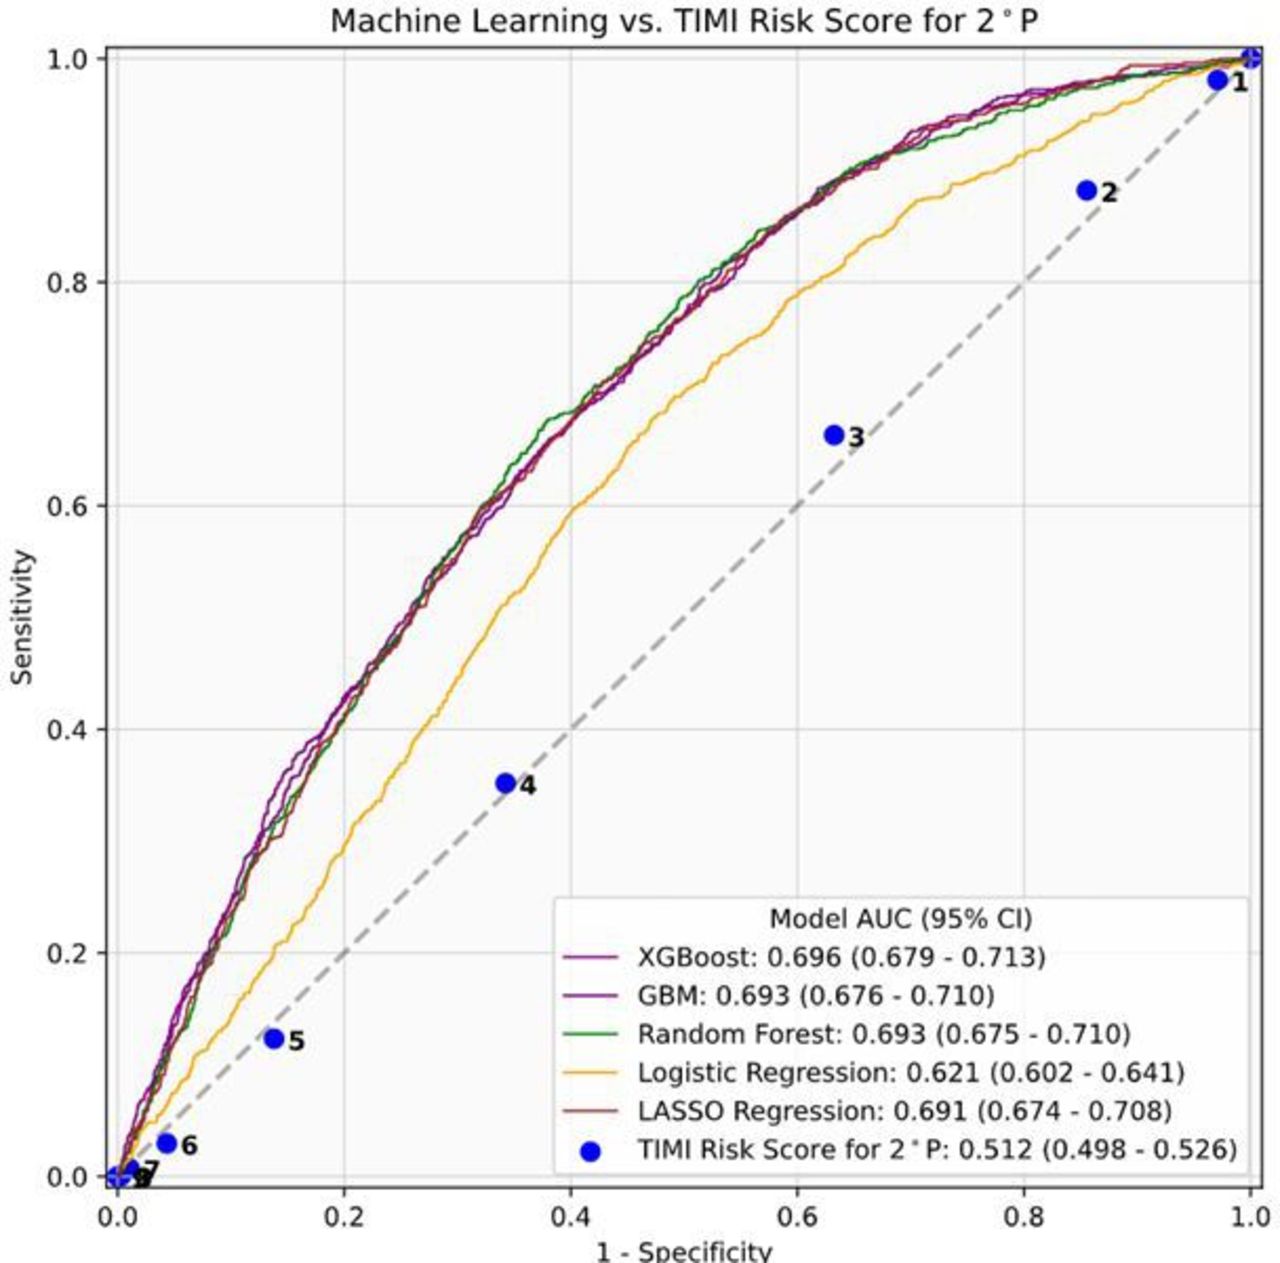
In the held-out test set of all patients with CVD, XGBoost (0.70, 95% CI 0.68 to 0.71), GBM (AUC 0.69, 95% CI 0.68 to 0.71), RF (AUC 0.69, 95% CI 0.67 to 71) and Lasso regression (AUC 0.69, 95% CI 0.67 to 0.71) performed comparably for CVD event risk stratification (figure 2). In comparison, the TRS 2°P model performed poorly, with AUC 0.512 (95% CI 0.498 to 0.526).

Machine learning model and TRS 2°P performance for risk stratification among all patients with CVD, demonstrating area under the receiver operative characteristic curve (AUC) values and 95% CI. CVD, cardiovascular disease; GBM, gradient boosting machine; TRS 2°P, TIMI risk score for secondary prevention; XGBoost, extreme gradient boosting.
Among 23 475 patients with ASCVD, a total of 10 114 patients had calculable TRS 2°P scores, and 2899 patients experienced an outcome event. In this subcohort, XGBoost (AUC 0.71, 95% CI 0.69 to 0.73), GBM (AUC 0.70, 95% CI 0.68 to 0.72), RF (AUC 0.70, 95% CI 0.68 to 0.72) and Lasso regression (AUC 0.70, 95% CI 0.68 to 0.72) again performed comparably (figure 3). The TRS 2°P model performed poorly, with AUC 0.50 (95% CI 0.48 to 0.52). Online supplemental tables 4 and 5 outline extended performance metrics for the XGBoost model in the full CVD and ASCVD cohorts, respectively.
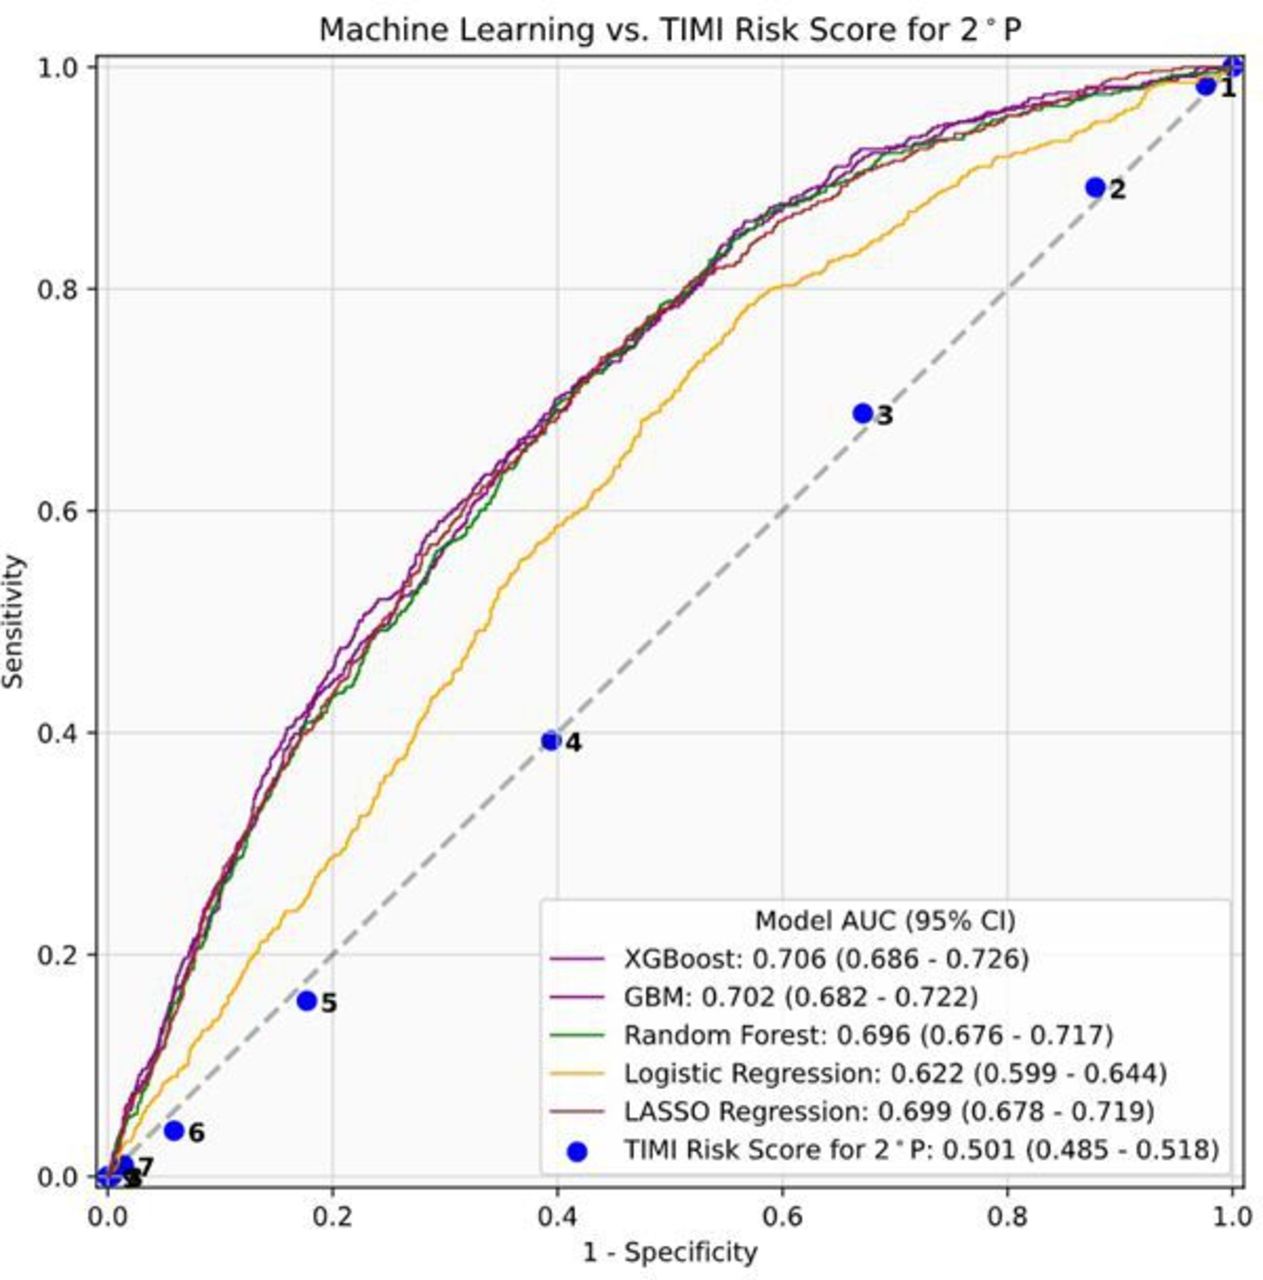
Machine learning model and TRS 2°P performance for risk stratification among patients, demonstrating area under the receiver operative characteristic curve (AUC) values and 95% CI. ASCVD, atherosclerotic cardiovascular disease; GBM, gradient boosting machine; TRS 2°P, TIMI risk score for secondary prevention; XGBoost, extreme gradient boosting.
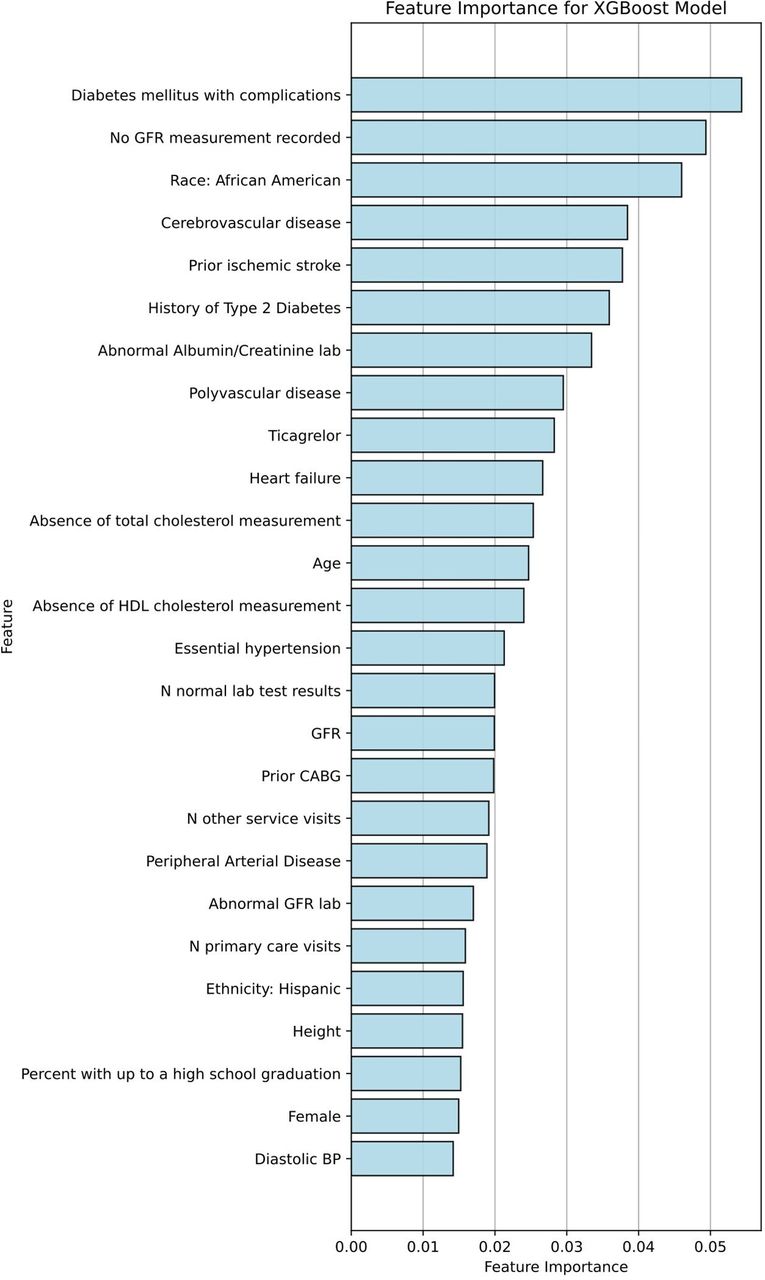
The top predictive variables identified by XGBoost, a top-performing model in the full cohort, included traditional risk factors including diabetes, hypertension, and age; established CVD including history of cerebrovascular disease/stroke, CABG, peripheral arterial disease or polyvascular disease; Hispanic ethnicity or black race; and nontraditional factors including healthcare utilisation (number of visits) and education level (figure 4). The top predictive variables identified by XGBoost in the ASCVD cohort also included traditional risk factors, prior CVD, as well as non-traditional risk factors including healthcare utilisation and education level (figure 5).

Predictive variables for CVD risk in the XGBoost model for all patients with CVD. As an example of model interpretability, feature rankings for the top variables are visualised for XGBoost, one of the top performing ML models. BP, blood pressure; CABG, coronary artery bypass grafting; CVD, cardiovascular disease; GFR, glomerular filtration rate; ML, machine learning; XGBoost, extreme gradient-boosted models.

Predictive variables for CVD risk in the XGBoost model for patients with ASCVD. As an example of model interpretability, feature rankings for the top variables are visualised for XGBoost, one of the top performing ML models. Ag, antigen; ASCVD, atherosclerotic CVD; BP, blood pressure; CABG, coronary artery bypass grafting; CVD, cardiovascular disease; GFR, glomerular filtration rate; ML, machine learning; XGBoost, extreme gradient-boosted models.
Discussion
In a cohort of multiethnic secondary prevention patients, ML models trained on EHR data predicted 5-year CVD event risk and significantly outperformed the TRS 2°P score. ML identified traditional and nontraditional predictive variables for CVD risk including education level and primary care visits.
Most CVD events occur in individuals that have already had a CVD event.2 In comparison with primary prevention tools such as the PCE, widely used risk stratification tools for secondary prevention remain lacking in contemporary practice. The previously described TRS 2°P score for secondary prevention performed poorly in the present study, potentially because it was developed and validated in clinical trial cohorts with limited applicability to our real-world population.1 9 18 TRS 2°P was also calculable in only 40% of our CVD cohort due to missing variables, a known characteristic of real-world data, thus, further limiting its applicability. In contrast, ML models were applicable across our full cohort. As seen in prior work, ML can effectively tackle missing data in real-world settings to allow risk stratification broadly.11 Developing such risk stratification tools is crucial for prevention as they may first underscore the need to close existing standard-of-care gaps in high-risk patients, such as guideline-directed statin use—which was less than 50% in our study (but similar to other studies).19 Risk stratification may further prompt targeted treatment intensification such as the use of proprotein convertase subtilisin/kexin type 9 inhibitors in patients with dyslipidaemia.1
Other prediction models for established CVD have been described, but with inconsistent performance, restricted inclusion criteria and lack of wide clinical use. The ACC/AHA very high-risk criteria demonstrated poor performance in the Second Manifestations of Arterial Disease study with a C-statistic of 0.54, and in the Reduction of Atherothrombosis for Continued Health registry with a C-statistic of 0.53. An algorithm developed from 912 patients with stable coronary heart disease in the Heart and Soul study demonstrated a C-statistic of 0.65 in a validation cohort.5 A Framingham-derived prediction model for secondary events has poor performance for CVD risk discrimination.5 A risk score for stroke, MI and death in patients with stable angina that was developed from A Coronary disease Trial Investigating Outcome with Nifedipine Gastrointestinal Therapeutic System cohort excluded patients with left ventricular dysfunction, recent coronary events or interventions, planned coronary interventions and clinical heart failure from its derivation cohort, limiting generalisability.20 Other models were limited to populations of stable angina or coronary disease, and demonstrated varying levels of complexity and poorer performance with nonfatal outcomes.21–23 To the best of our knowledge, our effort is the first to broadly include CVD conditions without restriction to develop and evaluate ML-based models in comparison with the established TRS 2°P score and identify nontraditional predictive variables such as socioeconomic factors.
Several ML models in this study achieved performance on par with well-accepted predictive models in cardiology. The PCE for primary prevention risk stratification demonstrated an AUC (reported there as the C-statistic, an alternative name for AUC) of 0.73 in the Women’s Health Initiate Cohort and AUCs of 0.68 (men) and 0.69 (women) in the Cardiovascular Health Study.24–26 The CHA2DS2 -VASc score, a model widely used for stroke prediction in atrial fibrillation patients, has an AUC of 0.68 in the Clinical Practice Research Datalink Database.27
Penalised LR (LASSO) performed comparably to more complex tree-based models in our study. This suggests that the richness of the EHR-derived patient feature set may be more important than the specific choice of model used. This also highlights the importance of broadly evaluating models across the range of complexity when developing ML approaches for health, rather than choosing complex or computationally expensive models with higher resource needs a priori. We also identify insights from the ML rather than presenting the ML as black box models whose recommendations must be taken on faith. Interpretable, locally trained models may reveal relevant nontraditional risk factors applicable to the local population. Markers of education level and healthcare utilisation were among the top predictive variables in our cohort, highlighting their relevance for CVD risk and associated disparities. Black race and Hispanic ethnicity were predictive of CVD risk as well. Prior CVD and traditional variables such as age, blood pressure, cholesterol and diabetes are established predictors of CVD risk; this was reinforced by the ML feature importance rankings.
Our study has certain limitations. Our cohort was composed of likely insured patients from Northern California and may not be generalisable across the USA. However, our cohort is enriched with Hispanic and Asian populations as well as older adults, who have generally been excluded for CVD risk prediction cohorts.28 The use of systems not built for research purposes such as Social Security records and EHR data may have inherent limitations.29 We assess ML performance in a held-out test set; external validation can help assess wide generalisability. Given the heterogeneity of CVD populations, a single, static risk stratification model with fixed variables may be less likely to be widely generalisable, as suggested by the poor performance of TRS 2°P in our cohort. Prioritising wide ML model generalisability during development could in turn compromise local performance.1 30 Instead, a flexible ML pipeline that can be ‘retrained’ in local populations, especially if less complex approaches like penalised LR are employed, may be preferable to preserve local real-world performance.12
Conclusion
EHR-trained ML models stratified CVD risk for secondary prevention in multiethnic patients while significantly outperforming the TIMI risk score for secondary prevention. EHR-trained ML approaches may be used to improve risk stratification in diverse secondary prevention populations to guide targeted treatment intensification.
Data availability statement
No data are available. The data analysed during the current study are not publicly available. Due to reasonable privacy and security concerns, the underlying EHR data are not easily redistributable to researchers other than those engaged in the Institutional Review Board-approved research collaborations in the current project. The corresponding author may be contacted for access to EHR data for an IRB approved collaboration.
Ethics statements
Patient consent for publication
Ethics approval
The study was approved by the Stanford University Institutional Review Board.
References
Supplementary materials
Supplementary Data
This web only file has been produced by the BMJ Publishing Group from an electronic file supplied by the author(s) and has not been edited for content.
Footnotes
DS and FR contributed equally.
AS and AW contributed equally.
Contributors AS and AW contributed equally to this paper as joint first authors. DS and FR also contributed equally to this paper as joint senior authors. All authors made substantial contributions to the conception and design of the work, and interpretation and analysis of the data. All authors were involved in drafting and critically revising the paper. All authors have reviewed and approved the final version of the paper and accept full responsibility for the finished work. FR is the guarantor and accepts full responsibility for the work and/or the conduct of the study, had access to the data, and controlled the decision to publish.
Funding FR received support from the National Heart, Lung and Blood Institute, National Institutes of Health (1K01HL144607) and the American Heart Association/Robert Wood Johnson Harold Amos Medical Faculty Development Program. AS received support from the American Heart Association (Grant 20SFRN35360178). AW was supported by the Department of Defense through a National Defense Science and Engineering Graduate Fellowship.
Competing interests Outside of the submitted work, FR reports equity from HealthPals and Carta, and advisory board and consulting fees from NovoNordisk, HealthPals and Novartis.
Provenance and peer review Not commissioned; externally peer reviewed.