Article Text

Abstract
Background Aims of this cross-sectional study were to assess: the relative contribution of left ventricular (LV) systolic long-axis shortening (mean mitral annular plane systolic excursion, MAPSE) to stroke volume (SV), the mechanisms for preserved ejection fraction (EF) despite reduced MAPSE, the age dependency of myocardial volume and myocardial systolic compression.
Methods Linear dimensions and longitudinal and cross-sectional M-modes were acquired in 1266 individuals without history of heart disease, diabetes or known hypertension from the third wave of the Nord-Trøndelag Health Study. Measurements were entered into a half-ellipsoid LV model for volume calculations, and volumes were related to age, body size (body surface area, BSA), sex and blood pressure (BP).
Results Mean BP and proportion with hypertensive values increased with increasing age. MAPSE contributed to 75% of SV, with no relation to age or BSA as both MAPSE and SV decreased with increasing age. LV end-diastolic volume (LVEDV) and SV increased with BSA and decreased with higher age; EF was not related to age or BSA. Myocardial volume increased with higher age and BSA, with an additional gender dependency. The association of age with myocardial volume was not significant when corrected for BP, while both systolic and diastolic BP were significant associated with myocardial volume. Myocardial compression was less than 3%.
Conclusions MAPSE contributes approximately 75% and short axis shortening 25% to SV. Both decline with age, but their percentage contributions to SV are unchanged. EF is preserved by the simultaneous decrease in LVEDV and SV. Myocardial volume is positively associated with age, but this is only related to higher BP, which may have implications for BP treatment in ageing. The myocardium is near incompressible.
- echocardiography
- cardiac function
- hypertension
This is an open access article distributed in accordance with the Creative Commons Attribution Non Commercial (CC BY-NC 4.0) license, which permits others to distribute, remix, adapt, build upon this work non-commercially, and license their derivative works on different terms, provided the original work is properly cited, appropriate credit is given, any changes made indicated, and the use is non-commercial. See: http://creativecommons.org/licenses/by-nc/4.0/.
Statistics from Altmetric.com
Key questions
What is already known about this subject?
The relative contributions of systolic short-axis and long-axis shortening to stroke volume is still disputed.
Long-axis shortening decreases with increasing age, but ejection fraction is preserved, although the mechanism is unresolved.
Left ventricular (LV) wall thickness increases with age, but as the ventricular length decrease simultaneously, the effect on LV mass is uncertain.
The myocardium is considered relatively incompressible, but the degree of incompressibility is little studied.
What does this study add?
This study indicates that long-axis shortening is the main contributor to the stroke volume. Even though long-axis shortening declines with age, end-diastolic volume and stroke volume decreases simultaneously preserving both the contribution of long-axis shortening to stroke volume, and the ejection fraction, while there is no increase in short-axis function.
As there is increased wall thickness but decreased LV length, volume and mass do not increase with age per se, but the increase is relative to higher blood pressure by age.
There is little systolic compression of the myocardium, and the compressibility is not related to age blood pressure or body size. This is important for the understanding of the geometry of myocardial systolic deformation.
Key questions
How might this impact on clinical practice?
The study shows the importance of long-axis shortening as a measure of LV function and the age-dependent decline of myocardial function. Mean mitral annular plane systolic excursion is a useful measure of LV useful and contributes to 75% of stroke volume independent of age, gender and body size. It also elucidates that geometric changes renders ejection fraction less useful in age and hypertension related hypertrophy.
Furthermore, it is little effect of age on myocardial volume, although the ventricles become more spherical with higher age, so LV mass measurements should not be based on short-axis measures alone. The increase in LV volume with higher age is an effect of higher blood pressure with age, not ageing per se.
This may indicate that treatment of moderate hypertension is to be important also in higher age groups, especially in the presence of LV hypertrophy.
Introduction
Systolic deformation of the left ventricular (LV) comprises two deformations, longitudinal and transversal (short-axis) decrease,1 2 as shown in figure 1. The systolic reduction in total volume is a function of both. There have been various reports on the relative importance of the two components.3–10

Schematic diagram of the systolic deformation of the left ventricle. Systolic contours are shown by the broken lines, diastolic by the unbroken. (A) Outer, or total volumes. total volume=myocardial vol+cavity vol. The ventricle reduces both length and outer diameter, and the total volume decreases as a function of both deformations (orange and light red). if the myocardium is incompressible, the myocardial volume is the same in both diastole and systole. thus, diastolic cavity volume=total diastolic volume – myocardial volume and systolic cavity volume=total systolic volume – myocardial volume. Stroke volume=diastolic cavity volume – systolic cavity volume, which then must be diastolic total volume – systolic total volume. The systolic decrease of the outer volume must then equal the stroke volume (SV), irrespective of the internal configuration changes of the cavity and myocardium, which are irrelevant. The longitudinal shortening (MAPSE) X the cross-sectional mitral annular area makes up the fraction of the SV due to long axis shortening (light red cylinder). The remaining systolic outer volume reduction must be due to outer diameter shortening (orange). (B)Cavity and myocardial volumes. both total and cavity volumes can be measured by diameter and length in systole and diastole as detailed in the online supplemental appendix. Myocardial volume is total volume – cavity volume in end-diastole and end-systole, respectively. myocardial systolic compression is myocardial diastolic – systolic volume. Stroke volume = end-diastolic – end systolic cavity volume. The cavity decreases due to decrease of both diameter and length (dark and light violet), but the inner diameter decrease (endocardial fractional shortening) is due to both outer diameter shortening, and myocardial thickening, the latter being mainly a function of myocardial longitudinal shortening. MAPSE, mean mitral annular plane systolic excursion.
Supplemental material
With increasing age, there is a reduction in the LV long-axis shortening, both absolute shortening which equals mitral annular plane systolic excursion (mean mitral annular plane systolic excursion, MAPSE), and relative shortening; global longitudinal strain, except in one larger meta-analysis,11 (probably due to between-study variability), while the ejection fraction (EF) is preserved.12–18 It has been suggested that this is due to increased systolic short-axis contraction,19–22 but this is inconsistent with the well-documented unchanged endocardial fractional shortening (FS) with increasing age.23–28 Also, studies have demonstrated that all three strain components may be reduced in hypertrophic conditions,29–32 so increased short-axis function is not a prerequisite for preservation of EF in the presence of reduced long-axis shortening. We have previously found lower longitudinal, circumferential and transmural (radial) strain with increasing age in the present study population.1
LV wall thickens with increasing age.16 23 26–28 33 Contrarily to as previously believed, this does not necessarily mean an increase in LV mass,23 25 34 because LV length decreases with age.28 35 Furthermore, most study populations show an increase of blood pressure (BP) with age, which must be taken into account.
The myocardium is generally considered fairly incompressible.36 We have previously shown that by strain measurements that systolic compression was very low.1 The compressibility is pertinent for the relation between outer volume decrease and stroke volume (SV) (figure 1).
The objectives of this study were to assess:
The relative contribution of long-axis and short-axis shortening to SV.
The relations of LV end-diastolic volume (LVEDV), SV and EF with age, BP, sex and body size, and the mechanism for preserved EF despite reduced long-axis shortening with increasing age.
Changes in myocardial volume with age.
The amount of systolic myocardial systolic compression (MC) .
Methods
All basic measurements in this study have been published previously,1 18 28 and are from the echocardiographic substudy of the third wave of the Nord-Trøndelag Health Study (HUNT3) echo substudy. The basic linear measures are given in the online supplemental appendix. In the present study, measures are used in a half ellipsoid model to calculate volumes, as comprehensively described in the online supplemental appendix.
Study subjects
The study population was recruited from the HUNT3 Study and has been extensively described in previous papers.14 28 37 Briefly, of 50 839 participants of the HUNT3 Study a random sample restricted to two communities was invited to the echocardiographic study. After exclusion of subjects with a history of heart disease, hypertension or diabetes 1296 were included. After echocardiography, another 30 individuals with significant pathology on the echocardiogram were excluded. Thus, the study consisted of 1266 subjects with age 19–89 years. BP was measured three times by trained staff members using a Dinamap 845XT (GE Healthcare, Milwaukee, Wisconsin, USA). Measurements were made after 2 min of rest with the arm on a table, and the average of the second and third measurements was used in the analyses. Basic characteristics are given in table 1.
Basic population characteristics
All subjects gave their written informed consent to participate in the study.
Echocardiography
Subjects were examined in the left lateral supine position with a Vivid 7 scanner (version BT06, GE Ultrasound, Horten, Norway), with phased-array matrix transducers (M3S and M4S). One experienced echocardiographer (HD) did all the examinations, which included parasternal long-axis and apical two-chamber and four-chamber views. For each view, at least three consecutive cardiac cycles were recorded during quiet respiration. Mean B-mode frame rate was 44 frames per second.
Diastolic wall length (WL) was measured as the straight lines from epicardial apex to the mitral points in the four walls in diastole (figure 2A), and mean WL was calculated from four walls. This was converted to outer and inner LV diastolic length (LVLd and LVILd, respectively) as described in the online supplemental appendix. MAPSE was measured from reconstructed longitudinal M-mode of the mitral annulus in the same four points, and likewise averaged. Septal and posterior wall thicknesses in diastole (IVSd and LVPWd respectively) and systole (IVSs and LVPWs, respectively) and diastolic and systolic LV internal chamber diameters (LVIDd and LVIDs) were all measured in parasternal M-mode at the tip of the mitral leaflets (close to the papillary muscles) in end diastole (figure 2B). Values were averaged to diastolic and systolic wall thicknesses (WTd and WTs, respectively), and outer LV diastolic and systolic diameters (LVEDd and LVEDs) were calculated from LVIDd, LVIDs WTd and WTs. Endocardial FS was calculated as FS = (LVIDd – LVIDs) / LVIDd, and external FS from external diameters the same way. Derivation of remaining linear measures for volume calculations is described in the online supplemental appendix.
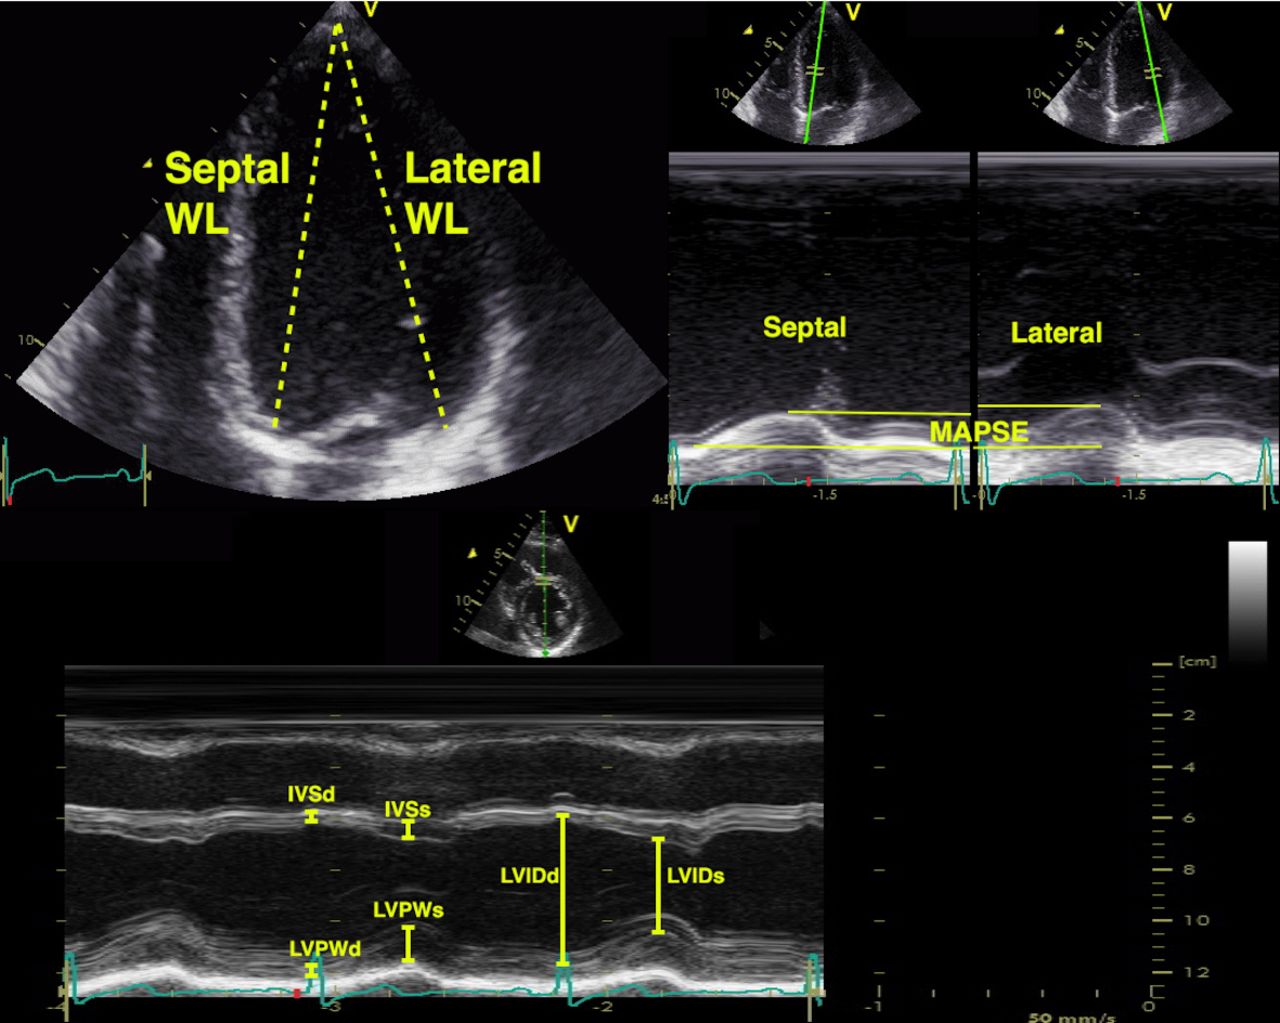
Measurements for the volume calculations. Top left: wall length (WL) measurements taken as a straight line from the epicardial apex to the mitral annulus, shown for the septal and lateral WL measurements in the four-chamber view. Top right, the reconstructed M-modes from the same mitral annular points, showing the apical motion (MAPSE) equal to the left ventricular shortening. In the study, the mean of four walls from four-chamber to two-chamber views were used. MAPSE: mean mitral annular plane systolic excursion; IVSd: diastolic septum thickness; IVSs: systolic septum thickness; LVPWd: diastolic posterior wall; LVPWs: systolic posterior wall; LVIDd: internal diastolic (cavity) diameter; LVIDs: internal systolic (cavity) diameter.
Calculations and statistics
Both calculations and statistics were done in SPSS V.23 (IBM). Ventricular volumes were calculated from the basic and derived linear dimensions in a half-ellipsoid model as described in detail in the online supplemental appendix. Briefly, a symmetrical half ellipsoid was assumed, with homogeneous wall thickness around the circumference, but with a wall thickness in the apex of 50% of the midwall thickness, in both diastole and systole. The calculations resulted in two ellipsoids, a total (outer) volume in diastole and systole, and an inner ellipsoid, representing the cavity. LV end-diastolic and end-systolic cavity volumes, respectively (LVEDV and LVESV) were the volumes of the internal ellipsoid. Myocardial diastolic and systolic volumes (MVd and MVs) were the differences between total volume and cavity volumes in systole and diastole, respectively, and MC was the relative difference between MVd and MVs. SV and EF was calculated from cavity volumes. Finally, the contribution of MAPSE to SV (MAPSE_SV) was calculated as MAPSE x mitral annular outer cross-sectional area, as shown in figure 1. The remaining part of the SV would be contribution by the short-axis function.
Means and SD are given as data were (near) normally distributed. The significance of differences between measures were tested by one-sample student’s t-test, between genders by independent samples t-test, differences between age groups (˂40 years, 40–60 and >60 years) were tested by one-way analysis of variance, with Bonferroni post hoc comparisons. Correlations were tested by full and partial (within BP groups) Pearson’s correlation and multiple linear regression.
Reproducibility of the basic measures have been published previously.28 38 Shortly, the inter analyser test–retest mean error was 10% for wall thickness and 5% for LV diameter. Coefficients of repetition (CoR) were 1.8 mm for IVSd, 2.4 mm for LVPWd and 5.4 mm for LVIDd. Mean error was 3%, and CoR was 1.6 mm for global MAPSE, and 3%, and 0.7 cm for mean WL, respectively.
Results
Study subjects
Age did not correlate with body mass index (BMI) and were only borderline significant associated with BSA (R=0.06, p=0.04). When multiple correlations were taken into account the association was non-significant. BSA was 15% higher in men than women, while BMI was only 3% higher in men (both p˂0.001).
None of the study population had a history of known hypertension (or antihypertensive treatment), diabetes or heart disease, and those with indications of heart disease on echo were excluded. However, it is evident from table 1 that there was some untreated hypertension in the material, most common in the highest age group. Both systolic (SBP) and diastolic BP (DBP) correlated with age, R=0.40 and 0.24, respectively (both p<0.001). SBP was significantly different between all three age groups, while DBP was not significant between the two oldest age groups in post hoc analysis. In the three age groups, <40, 40–60 and >60 years, respectively, 7%, 18% and 44% had SBP >140 mm Hg, and 24 %, 40% and 65% SBP >130 mm Hg, 3%, 9% and 10% had DBP>90 mm Hg, 12%, 31% and 59% had DBP>80 mm Hg. The BPs are shown in figure 3. The proportions with elevated BP at screening were slightly higher in men.
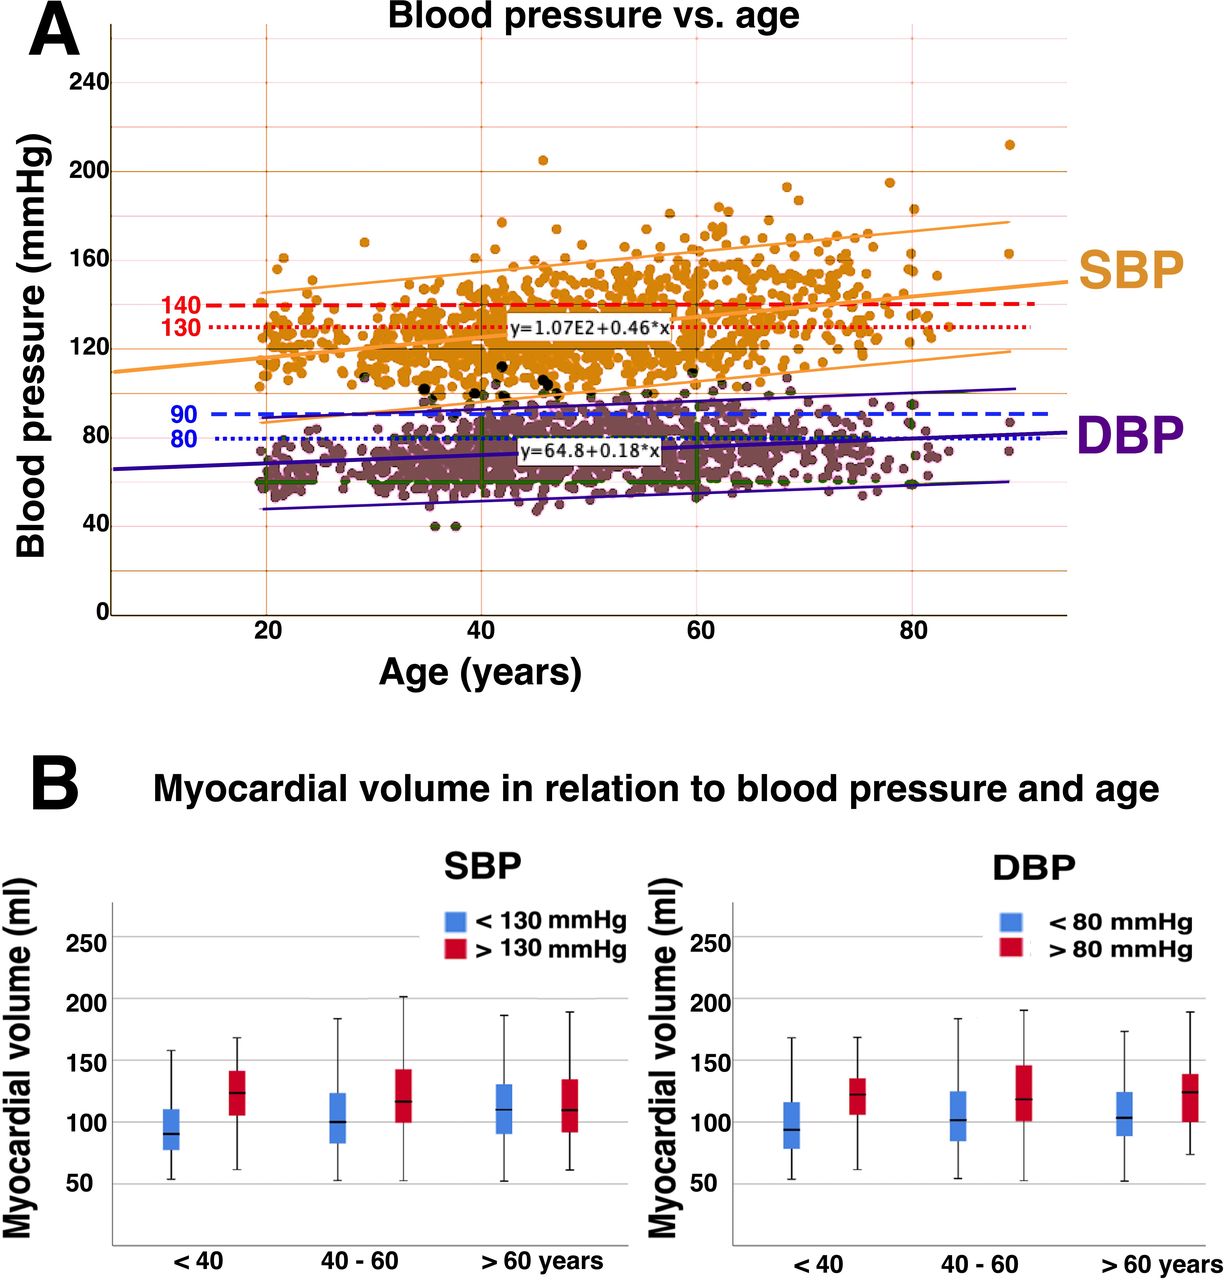
(A) Blood pressure in the study population. Upper limits of high normal blood pressure (130/80 mm Hg) and lower limit for hypertension (140/90 mm Hg) are indicated by the dotted lines. The study shows both increasing mean BP with increasing age, as well as increasing proportions with hypertensive values. (B) Myocardial volume in relation to SBP and DBP and age. Here, cut-off values of 130/80 mm Hg (high normal) was used, but as seen in the text, the volumes differed only 2–4 mL for a cut-off of 140/90 mm Hg. There was no significant correlation of myocardial volume with age within BP groups. BP, blood pressure; DBP, diastolic blood pressure; SBP, systolic blood pressure.
MAPSE contribution to SV
MAPSE and MAPSE_SV are given in table 2. MAPSE_SV was on the average 61.5 mL, 75% of the total SV. This means that external FS contributed 25% to the total SV. As shown previously,18 MAPSE correlated negatively with age (R=−0.50), weakly positively with BSA (R=0.12, p<0.001), and there was no significant sex difference. Furthermore, MAPSE correlated negatively with BP (R=−0.27 and −0.24 for SBP and DBP, respectively (both p<0.001). In linear regression analysis only age (β=−0.47, p<0.001) and DBP (β=−0.13, p<0.001) but not SBP, were significantly associated with MAPSE.
Conventional volumes and functional measures, and the contribution of long axis shortening to stroke volume according to age and gender
MAPSE_SV in % of SV did not correlate with age, BSA, SBP nor DBP.
LV cavity volumes, SV and EF
All measured and derived linear measurements used for calculations are given by age and gender in online supplemental table 1 and in the online supplemental appendix, most have been described previously.28 Conventional functional measures and model derived cavity volumes are given in table 2. The linear measures, both basic and derived, were all near normally distributed.28 Volumes, however, were moderately skewed as shown in figure 4, with skewnesses of 0.71, 0.65 and 0.55 for LVEDV, SV and MVd, respectively.

Distribution of the model derived volumes. The distribution is skewed, while the basic measures were not, so the skewness may be due to the model. LV, left ventricular; LVEDV; left ventricular end-diastolic (cavity) volume; MVd; end-diastolic myocardial volume; SV; stroke volume.
BSA correlated strongly with LVEDV, LVESV and SV with R of 0.58, 0.48 and 0.50, respectively (all p<0.001), but not with EF and FS. There were significant sex differences (p<0.001) for all volumes, both sex and BSA remained significant in linear regression. The sex difference in EF of 1% point was also significant (p<0.005), despite being of low clinical interest, while FS was not related to gender, as also shown previously.28
Age was weakly, negatively correlated with LVEDV and SV with R −0.12 and −0.13, respectively (both p<0.001), but showed no association with LVESV and EF. In linear regression with BP, age was negatively associated with LVEDV in multiple linear regression (ß=−0.18, p<0.001), but only DBP was borderline, weakly independently associated with LVEDV. (univariate R=0.09, ß=0.09, p=0.02). FS, LVESV, SV and EF did not correlate significantly with SBP or DBP, while external FS was 12.8%, and correlated negatively with age (R=−0.15) but not with BP.
Myocardial volumes and compressibility
Myocardial volumes and systolic compression are given in table 3. LV MVd was on the average 101 mL, with a significant sex difference (p<0.001). MVd correlated strongly with BSA (R=0.70, p<0.001), but both BSA and sex were independently associated with MVd in multiple linear regression (ß 0.50 and 0.32, respectively, both p<0.001).
Left ventricular myocardial diastolic and systolic volumes, and myocardial systolic compression
MVd was also significantly different between age groups (p<0.001). However, in post hoc analysis, the difference between the two oldest age groups was not significant, and the correlation with age was weak (R=0.14, p<0.001). Furthermore, there were no significant partial correlations with age controlling for BP groups, neither with cut-off 140/90 nor 130/80 mm Hg. Correlations with SBP and DBP was stronger with R 0.39 and 0.24, respectively (both p<0.001). In multiple linear regression, both SBP and DBP remained significant associated with MVd (ß=0.15 and 0.20, respectively, both p<0.001), while age did not. For SBP, MVd was 118 mL in men vs 102 mL in women for a cut-off of 130 mm Hg, and correspondingly 120 vs 106 for a cut-off of 140 mm Hg (p<0.001). For DBP, MVD was 122 vs 104 in men and women for a cut-off of 80 mm Hg, and 124 vs 108 for 90 mm Hg correspondingly (p<0.001). The distribution of MVd vs age groups and BP is shown in figure 3B.
MC was low, mean 3.1 mL, or 2.6% of MVD, 4.8% of SV. There were no correlations with age, BSA, SBP or DBP.
Discussion
The main findings of the study were:
Long-axis shortening contributed to 75% of the total SV, according to this model, and the proportion was independent of BSA, BP and age.
LVEDV and SV both decreased with higher age, and the ventricle became more spherical. EF remained unchanged, and so did endocardial FS. Both gender and BSA were associated with LV volumes, SV and myocardial volume.
Myocardial volume increased by age, but both SBP and DBP increased with higher age, and were associated with increasing myocardial volume. The age dependency of myocardial volume was not significant when adjusted for the higher BP with higher age.
MC was small, mean 2.6% of end-diastolic myocardial volume, 4.8% of SV. This compression was independent of BSA, gender, age and BP.
Study subjects
The average BMI was 25 kg/m2, indicating that half the population was overweight. However, this is a common finding in western countries today, and compared with the general HUNT3 population the values for BMI were slightly lower in the echocardiographical substudy.39BMI was similar in the study by Hees et al,35 and only slightly lower in the NORRE study.16 Despite exclusion of subjects with known hypertension, there was a proportion of hypertensives in this population. Even though the measured BPs being spot pressures at baseline examinations, the results, especially in view of the relation with myocardial volume, indicate a higher percentage of hypertensives with age.
Due to the large size, measurements are done with a limited set of simplified measurements. As the conventional LV dimensions and FS in this material (data in the online supplemental appendix) are in line with others,23 26 27 40 41 the population seems to be fairly representative. The results are based on an ellipsoid model, with limited validity, as discussed below. Basically, we assume the ventricle to remain ellipsoid with age. This is, granted, an additional assumption. The model itself assumes a symmetry that is not accurate, and the skewness of the true LV shape may well change with age. However, the actual shape of the ellipsoid changed, the external diameter increasing, the length decreasing. This is evident from the basic measurements themselves, and not only a function of the model.
MAPSE contribution to SV
The concept that the heart works mainly by the AV-plane motion, is not new, being proposed already by Leonardo da Vinci,42 and supported by experimental work in the 1930s,43 experimental CT studies44 from the 1980s, observational imaging studies in humans3 and lastly by cardiac magnetic resonance (CMR) imaging.5 Some has suggested that all of the SV is due to AV-plane motion,3 as the myocardium is incompressible, and that the decrease of LV diameter is due to wall thickening alone. However, with an external FS of 12.8%1 consistent with other findings,2 there has to be a component due to cross-sectional shortening as well.45 The contribution of MAPSE has been estimated to be as high as 83% in an echo study,4 and around 60% in recent CMR studies.,8 46 with the present results in-between these findings.
The total (outer) volume consists of the myocardium and the cavity. An incompressible myocardium will only change shape, not volume in systole. Thus, the outer volume systolic decrease must equal the decrease of the cavity volume, which is the SV. In the present study, the compressibility of the myocardium was low, so this approximation seems fair. But this means that the outer diameter shortening, and the longitudinal shortening are the determinants of the SV, as illustrated in figure 1. Thus, the internal relations of diameters, circumferences, lengths and cavity volumes are, in fact, irrelevant. SV, calculated from cavity volumes, will still give the absolute SV, but from the argument above, must equal outer volume decrease.
The contribution of MAPSE to SV equals the cross-sectional area of the base (external mitral annular area) x MAPSE, equal to the volume of a cylinder as shown in figure 1. In calculating the area, we used the systolic LV diameter rather than the diastolic, as this is probably closer to the annular diameter; LV external diameter is compressible while the mitral annulus is probably not. However, we included the whole annular thickness, as the SV relates to outer volume decrease. Using only the annular orifice diameter, as some authors have done7 will be erroneous, and result in too low contribution of MAPSE to SV.
Shortening of the outer circumference and diameter during systole must be due to circumferential fibre shortening, while both midwall and endocardial circumferences move inwards partly as a function of wall thickening, which again is partly a function of longitudinal shortening.1 3 4 8 47 This inward motion results in shortening of the midwall and endocardial circumferences and diameters and would have been present even without circumferential shortening. Thus, only outer circumferential shortening is independent of longitudinal shortening1 figure 1C. Mean speckle tracking derived circumferential strain10 is equivalent to midwall circumferential strain, and thus longitudinal shortening dependent.
The relative contribution of MAPSE to SV remained constant with higher age, due to the simultaneously lower MAPSE and SV. As the absolute value of MAPSE decreases with increasing age, the relation between MAPSE and EF changes with age, as already described by Emilsson et al.12 MAPSE correlated with BP, but only DBP was independently associated with MAPSE, so this was not an afterload effect, but rather hypertensive myocardial changes. The SBP range was possibly too small to give a significant afterload effect.
MAPSE was only weakly correlated with BSA. Both LVLd and LVEDd increase in proportion to BSA, and the ratio between them is BSA independent,28 thus, MAPSE_SV increases mainly by increased cross-sectional mitral annular area, as illustrated in figure 1. The increase in MAPSE by higher BSA18 will then be far less, explaining the relatively low BSA dependency of MAPSE.
LV volumes and EF
In this model of the LV, both diameter and length are taken into consideration, but the half ellipsoid model rests on assumptions. The most important assumption relates to geometric symmetry, which is not correct for the LV, but which is similar to the model by Stokke et al.10 As all the linear measures are normally distributed, while the model-based volumes are skewed, this may indicate a systematic error in the volumes. LVEDV and EF are higher than in the study by Kou et al,16 but means are still within the normal range for BSA indexed LVEDV given by Lang et al.33 Compared with the indexed LVIDd by CMR,35 values are fairly similar, while LV internal length is longer. MVd is slightly lower than the values for LV mass in the NORRE study,16 and even further below the CMR values by Hees.35 Those studies, however, do not indicate whether the values are normally distributed, but it may seem that our model may overestimate cavity volume and underestimate myocardial volume. Measurements in the present study are not intended to be normative, but systematic errors may be expected to be similar across ranges of BSA, genders, age groups and BPs, and the main issue of this study is the relations of measurements, not the values themselves.
In line with the expectations, LVEDV and SV increased with higher BSA, while EF, being SV/LVEDV was independent of BSA. Thus, also the proportional decrease of EDV and SV with higher age, can explain the unchanged EF by age, without any increase in cross-sectional function. Increased short-axis function is not a prerequisite for preserved EF in the presence of reduced long-axis shortening. LVIDd was independent of age, while both WT and LVEDd increased with age and LVL and LVILd decreased. Furthermore, there is little effect of age on myocardial volume, although the ventricles become more spherical with higher age, but t LVEDV and LVESV, being functions of internal length and diameter decreased, as described previously by CMR.35 As external FS decrease with increasing age, there is in fact no increase, but rather a decrease in cross-sectional LV function by age.
Myocardial volume and relation to age and BP
Related to the aim of assessing systolic compressibility, we measured myocardial volumes, not mass. Systolic compression means that the volume decreases, while the mass is unchanged. Every imaging modality in reality measures myocardial volume and converts to mass by a constant (usually 1.05) based on data from validation studies against autopsies. Thus, all relations of MVd by age, BSA and BP, are the same as for LV mass.
LV mass has been assumed to increase with age, from the observed age-related wall thickening. However, in the NORRE study16 using two-dimensional (2D) echo, only a weak relationship between age and LV mass was found, and only in women. The relationship of age and BP in the material is not given. In the CMR study of Hees,35 there was a significant increase in BP with age. LV mass was found to be unchanged with age in women, as the effect of increased WT were neutralised by decreased LVL, while LV mass decreased with age in men. Apart from body size, BP was found to be the strongest predictor for LV mass. In our study, there was, despite the finding of reduced LVL, a modest, but significant increase in MVd in both sexes, but this seems to be due exclusively due to the effect of higher BP with higher age. This may indicate that the relatively modest age-related increase in BP is clinically significant. As the presence of LV hypertrophy is a prognostic factor in hypertensive patients,48 49 treatment of moderate hypertension may be important also in the elderly. The diagnosis of LVH, however, should not be based on wall thickness alone.
Myocardial systolic compression
Strain interrelations will give an indication of the amount of incompressibility.1 However, different methods for calculating strains actually have different basic assumptions and technical solutions, so there is no ‘gold standard’ for strain, and thus, the relations between strain cannot be used for calculating the absolute compressibility. The volume calculation in the present paper shows about 2.6% compression of the myocardial volume, but this is still significant. Some degree of compression of capillaries and crypts is to be expected, but from this study, it is small. Our findings indicate that myocardial compression detracts only about 5% from the SV. We have no data to support that compressibility in the transverse and longitudinal direction differ. If this is the case, the contribution of MAPSE to SV would remain the same even if compression had been taken into account.
Study strength and limitations
The main strength of the study is the size, being one of the largest normal echocardiography studies. The acquisitions and analyses are done by one single experienced echocardiographer, ensuring homogeneity of data.
M-mode measurements are prone to systematic errors. However, these systematic errors will be similar across age groups, body sizes and genders, so the differences may still be representative, even if values are not. Also, the population shows very little skewness in the basic measurements.18 28 50 The main limitation is the volume model, as discussed previously, with a set of assumptions that are not completely realistic. This may cause the skewness of the volume data, but any systematic error may likewise be supposed to be fairly constant across age, BP and sex.
MAPSE is measured by reconstructed M-mode. This means the temporal resolution is the same as in 2D B-mode, which is low compared with real-time M-mode. As the movement of the mitral ring is near zero at end systole and end diastole, this is of little importance. Also, speckle tracking is done in B-mode with the same sampling rate, so reconstructed M-mode and speckle tracking are equivalent with respect to time resolution. In the present study, we have used the MAPSE from the mean of four walls, not six. This is because that was the original approach,40 41 51 and we have previously shown that the difference in mean MAPSE from four and six walls was 0.7 mm, while variability was larger with six walls.18
The effect of age is not true ageing, as this is a cross-sectional, not a cohort study. The population in the HUNT Study is ethnically homogeneous. As the values are not intended to be normative, this is of less importance, but may still be important for gender, age and BP effects in ethnically different populations.
Conclusions
Long-axis shortening contributes to approximately 75% to SV, external diameter shortening to 25%, and these proportions are independent of body size and age, as there are simultaneous changes in long-axis shortening and SV with changes in age and BSA. Both LVEDV and SV decreased with age, thus preserving EF with higher age, without any increase in short-axis function. In fact, the short-axis function also decreased with age. Myocardial volume increased with higher BP and did not increase with highere age after adjustment for BP, as wall thickness increased, but LV length decreased with increasing age. Finding of increasing LV volume with increasing BP may have implications for treatment of moderate hypertension, even in the elderly. The LV myocardium is near incompressible and the compressibility is independent of age, BSA or BP.
References
Footnotes
Twitter @strain_rate
Contributors The study was conceived and designed by AS, all the echo examinations, as well as some of the measurements were done by HD and the wall length and MAPSE measurements by HEM, while AS did the calculations and the geometric and statistical analyses. All of the authors contributed to the writing and revision of manuscript and approved the final draft.
Funding The study was fully sponsored by the Norwegian University of Science and Technology, as a PhD grant, as well as the HUNT Study providing the infrastructure for the Echocardiography in HUNT3 Study.
Competing interests None declared.
Patient consent for publication Not required.
Ethics approval The study was approved by the Regional Committee for Ethics in Medicine and Research (REK Mid-Norway 4.2009.397 and 2018/929).
Provenance and peer review Not commissioned; externally peer reviewed.
Data availability statement Data are available on reasonable request. Deidentified patient data are deposited in the HUNT database. Echo data are in the department database (NTNU department of circulation and medical imaging).