Article Text

Abstract
Background Measurement of the contrast-flow quantitative flow ratio (cQFR) is a novel method for rapid computational estimation of fractional flow reserve (FFR). Discordance between FFR and cQFR has not been completely characterised.
Methods We performed a post-hoc analysis of 504 vessels with angiographically intermediate stenosis in 504 patients who underwent measurement of FFR, coronary flow reserve (CFR), the index of microcirculatory resistance (IMR) and Duke jeopardy score.
Results In total, 396 (78.6%) and 108 (21.4%) lesions showed concordant and discordant FFR and cQFR functional classifications, respectively. Among lesions with a reduced FFR (FFR+), those with a preserved cQFR (cQFR−) showed significantly lower IMR, shorter mean transit time (Tmn), shorter lesion length (all, p<0.01) and similar CFR and Duke jeopardy scores compared with lesions showing a reduced cQFR (cQFR+). Furthermore, lesions with FFR+ and cQFR− had significantly lower IMR and shorter Tmn compared with lesions showing a preserved FFR (FFR−) and cQFR+. Of note, in cQFR+ lesions, higher IMR lesions were associated with decreased diagnostic accuracy (high-IMR; 63.0% and low-IMR; 75.8%, p<0.01). In contrast, in cQFR− lesions, lower IMR lesions was associated with decreased diagnostic accuracy (high-IMR group; 96.8% and low-IMR group; 80.0%, p<0.01). Notably, in total, 31 territories (6.2%; ‘jump out’ group) had an FFR above the upper limit of the grey zone (>0.80) and a cQFR below the lower limit (≤0.75). In contrast, five territories (1.0%; ‘jump in’ group) exhibited opposite results (FFR of ≤0.75 and cQFR of >0.80). The ‘jump out’ territories showed significantly higher IMR values than ‘jump in’ territories (p<0.01).
Conclusions FFR− with cQFR+ is associated with increased microvascular resistance, and FFR+ with cQFR− showed preservation of microvascular function with high coronary flow. Microvascular function affected diagnostic performance of cQFR in relation to functional stenosis significance.
- coronary artery disease
- fractional flow reserve
- microvascular disease
- coronary flow
This is an open access article distributed in accordance with the Creative Commons Attribution Non Commercial (CC BY-NC 4.0) license, which permits others to distribute, remix, adapt, build upon this work non-commercially, and license their derivative works on different terms, provided the original work is properly cited, appropriate credit is given, any changes made indicated, and the use is non-commercial. See: http://creativecommons.org/licenses/by-nc/4.0/.
Statistics from Altmetric.com
Key questions
What is already known about this subject?
Measurement of the contrast-flow quantitative flow ratio (cQFR) is a novel method for rapid computational estimation of the fractional flow reserve (FFR) derived from three-dimensional quantitative coronary angiography. The cQFR has been developed and validated to estimate the FFR and showed high accuracy for estimating the FFR in previous studies.
What does this study add?
Despite the high agreement rate, discrepancy between the FFR-guided and cQFR-guided decision-makings was documented in 20% of patients when the cut-off value of 0.80 was used. We demonstrated that microvascular resistance influenced the discordant functional assessment between the cQFR and FFR, whereas no significant difference was found in the subtended cardiac mass.
How might this impact on clinical practice?
Larger prospective studies are warranted to clarify the potential utility of cQFR-guided versus FFR-guided decision-making, especially in the identification of microvascular dysfunction and coronary flow.
Introduction
Measurement of the fractional flow reserve (FFR) has become a standard practice for revascularisation decision-making in evaluating the functional significance of angiographically intermediate epicardial coronary stenosis.1 2 Despite the supporting evidence for the FFR, adoption and penetration of FFR measurements has been limited.3 4 This may be related to the cost of the pressure wire and limitations associated with induction of hyperaemia. A practical tool that facilitates FFR calculation without a pressure wire or hyperaemic induction could supplement FFR-guided revascularisation decision-making. Invasive quantitative coronary angiography (QCA)-based computational FFR by various methods has been reported. The contrast-flow quantitative flow ratio (cQFR) was recently developed and validated to estimate the FFR.5 6 The Functional Assessment by Various Flow Reconstructions (FAVOR) pilot study showed the potential of QFR calculation in identifying the functional stenosis by core laboratory-based calculations.5 In the Functional Diagnostic Accuracy of Quantitative Flow Ratio in Online Assessment of Coronary Stenosis study (FAVOR China II study), the cQFR was compared with the FFR and exhibited an overall diagnostic accuracy of more than 90% for detecting an FFR of ≤0.80.7 Subsequent studies showed similar results for online assessment of intermediate stenosis or the use of myocardial perfusion imaging as the reference standard to define myocardial ischaemia.7 8 Despite the high agreement rate, the FFR and cQFR show a discrepancy of 10%–20% when an FFR cut-off value of 0.80 is used to guide revascularisation.5 9 The cQFR is calculated based on a contrast-flow hyperaemic flow velocity model derived from coronary angiography (CAG) without pharmacologically induced hyperaemia. The contrast-flow is converted to virtual hyperaemic flow obtained from previous studies and applied as if vasodilator drugs had been administered.5 6 We hypothesised that discordant decision-making between FFR and cQFR might be related to the difference in the individual microvascular function represented by the index of microcirculatory resistance (IMR), both resulting in the decreased diagnostic accuracy in lesions with increased microvascular resistance as reported,10 and also resulting in lower agreement in lesions with decreased microvascular resistance. Furthermore, because the IMR is reportedly inversely associated with the amount of myocardium subtended by a coronary stenosis, we also evaluated the influence of myocardial mass subtended by an intermediate stenosis and other clinical factors on the discordant decisions between these two measures.11
Materials and methods
Study population
This post-hoc analysis included patients from the data sets of previous studies from our institution performed from January 2011 to June 2017.12 All screened patients had suspected or known stable coronary artery disease and underwent invasive CAG with physiological lesion assessment using a pressure–temperature sensor-tipped guide wire (PressureWire; St. Jude Medical, St. Paul, MN, USA). Lesions showing an angiographically visible stenosis of 30%–80% by visual estimation were included. In multivessel coronary artery disease, a single vessel with the lowest FFR value was included for the current analysis. The exclusion criteria were presented in an online supplementary file methods 1. This study was performed in compliance with the Declaration of Helsinki for investigation in human beings. The study protocol was approved by the institutional review board, and all patients provided written informed consent for enrolment in the institutional database for potential future investigations. All patient data and procedural details were obtained from the patients’ medical records.
Supplemental material
Coronary catheterisation and physiological measurements
Coronary catheterisation and physiological measurements were performed as previously described,13 14 and shown in an online supplementary file methods 2.
Computation of cQFR
Computation of the cQFR was performed offline using a proprietary software package (QAngio XA 3D Research Edition 1.1; Medis Specials BV, Leiden, The Netherlands). First, two angiographic images at least 25° apart were transferred to a computer equipped with a QFR system, and three-dimensional reconstruction of the interrogated vessel was performed with a few steps with observer interaction as previously described.5 6 The concept and basis of the underlying principles of QFR have been described elsewhere.5 6 The contrast-flow model uses a Thrombolysis in Myocardial Infarction (TIMI) frame count model to derive the contrast flow velocity from CAG. Frame count analysis was separately performed on the two angiographic projections without pharmacologically induced hyperaemia. Previous studies reported that cQFR showed a better diagnostic accuracy compared with fixed-flow QFR. Thus, we used cQFR values in this study. The cQFR value was obtained at the position where the FFR value was measured by referring to the fluoroscopic image for the sensor position documentation. cQFR analysis was performed by two well-trained investigators (YKanno and MHo) blinded to the FFR data.
Reference standard of functionally significant stenosis and discordance of decision-making between FFR and cQFR
The pressure–temperature sensor-tipped wire-derived FFR was used as the reference standard, and the diagnostic accuracy of the cQFR was assessed. The ischaemic threshold was defined as 0.80 for both measures. Furthermore, we investigated the occurrence and frequency of functional assessment that jumped beyond the grey zone (0.75–0.80) into the opposite decision-making zone between FFR-guided and cQFR-guided decision-making. The ‘jump out’ group was defined as a cQFR of ≤0.75 with an FFR of >0.80, and the ‘jump in’ group was defined as a cQFR of >0.80 with an FFR of ≤0.75. Representative cases in the ‘jump out’ and ‘jump in’ groups are shown in figure 1. We assessed whether hyperaemic microvascular resistance represented by the IMR and the cardiac mass subtended by the lesion described by the Duke jeopardy score were associated with discordance between FFR-based and cQFR-based decision-making. We also compared cQFR-based decision-making with QCA assessment by 50% diameter stenosis.

Representative cases in ‘jump out’ and ‘jump in’ groups. Representative cases with cQFR ≤0.75 and FFR >0.80 (A, ‘jump out’) and cQFR >0.80 and FFR ≤0.75 (B, ‘jump in’). The ‘jump out’ case of LAD lesion showed cQFR of 0.75 nevertheless FFR of 0.83. This ‘jump out’ lesion had high IMR. The ‘jump in’ case of LCx had cQFR of 0.83 nevertheless FFR of 0.74. This jump in’ lesion had low IMR. cQFR, contrast-flow quantitative flow ratio; FFR, fractional flow reserve; IMR, index of microcirculatory resistance; LAD, left anterior descending artery; LCx, left circumflex artery.
Statistical analysis
The statistical analysis was performed using the SPSS V.23.0. Categorical data are expressed as absolute frequencies and percentages, and were compared using the χ2 test or Fisher’s exact test, as appropriate. Continuous variables are expressed as mean±SD for normally distributed variables and as median (25th–75th percentile) for non-normally distributed variables. Analysis was performed with the Mann–Whitney U test or Kruskal–Wallis test for variables with a non-normal distribution and with Student’s t test or analysis of variance for variables with a normal distribution. Correlations between the two parameters were evaluated using linear regression analysis. Receiver operating characteristic curves were analysed to assess the best cut-off values of the cQFR to predict an FFR of ≤0.80. A two-sided p-value of <0.05 indicated statistical significance. To assess reproducibility between cQFR and coronary flow reserve (CFR), or FFR and CFR, we calculated Cohen’s kappa coefficient.
Results
Patient and vessel angiographic characteristics
Among 643 lesions of 643 patients for cQFR calculations, 139 lesions were excluded from the final analysis. The reasons for exclusion were as follows: insufficient waveform quality, pressure drift, or missing/suboptimal physiological data set (56 lesions), insufficient angiograms for cQFR calculations (57 lesions in total; 27 lesions: vessel overlap and shortening, 18 lesions: suboptimal contrast flow and 12 lesions: lack of two angiographic projections>25° apart) and no fluoroscopic documentation of the wire position of FFR measurement for use as a point of cQFR calculations (26 lesions). Therefore, the final analysis included 504 lesions of 504 patients. The median FFR, CFR and IMR values were 0.81 (0.74–0.87), 2.7 (1.8–3.7) and 19.0 (12.6–27.5), respectively. Among all 504 lesions, 67.7% of the FFR values were distributed within the intermediate range of 0.70–0.90. Table 1 shows the baseline and clinical characteristics. Table 2 shows per-patient and per-vessel characteristics in categories divided according to FFR and cQFR. The mean age of the patients was 66.9±9.4 years, 88 (17.5%) were women and 210 (41.7%) had diabetes. Among the 504 lesions, 193 (38.3%) showed concordantly preserved results in the FFR and QFR measurements (FFR of >0.80 and cQFR of >0.80; FFR−/cQFR−), and 203 lesions (40.3%) showed concordantly reduced results in the FFR and cQFR measurements (FFR of ≤0.80 and cQFR of ≤0.80; FFR+/cQFR+). Among 108 (21.4%) discordant results, 73 lesions (14.5%) showed a preserved FFR and decreased cQFR (FFR of >0.80 and cQFR of ≤0.80; FFR−/cQFR+), and 35 lesions (6.9%) showed a reduced FFR and preserved cQFR (FFR of ≤0.80 and cQFR of >0.80; FFR+/cQFR−) (figure 2). When the total cohort was divided into a concordant group (396 lesions, 78.6%) and discordant group (108 lesions, 21.4%), no significant difference in clinical or physiological characteristics was found between these two groups. The diagnostic sensitivity, specificity, accuracy, positive predictive value and negative predictive value of the cQFR for predicting an FFR of ≤0.80 were 85.3%, 72.6%, 78.6%, 73.6% and 84.6%, respectively. The area under the receiver operating characteristic curve using the cut-off threshold of ≤0.80 for the FFR was 0.84 (95% CI, 0.81 to 0.88) for the cQFR. Cohen’s kappa coefficient between FFR and cQFR categorisation was moderate (0.57, p<0.001). The linear correlations between FFR/CFR and cQFR/CFR were similar (R=0.32, p<0.01 and R=0.35, p<0.01, respectively).
Baseline characteristics
Patient and lesion characteristics in categories divided according to FFR and cQFR
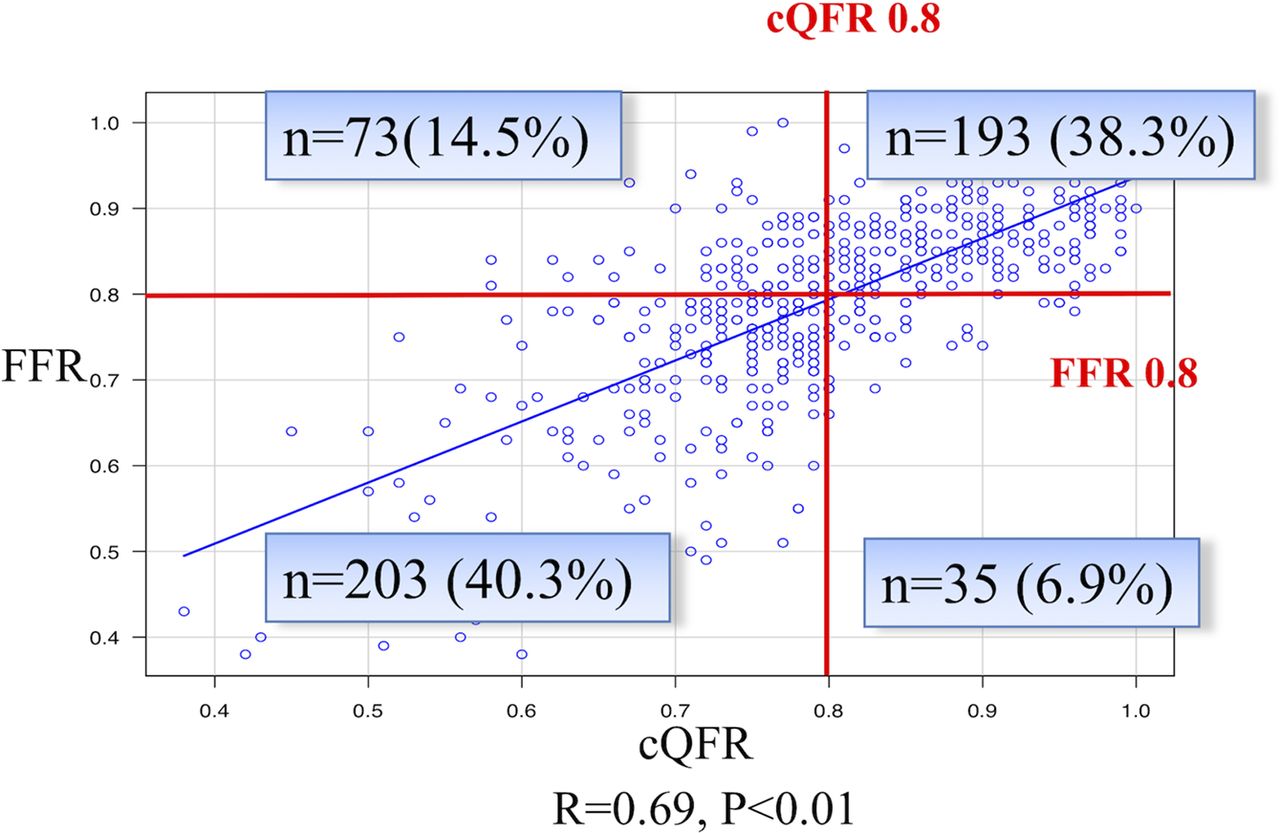
Agreement between FFR and cQFR. Scatter plot showing linear correlation between the FFR and cQFR. A good correlation was observed between the FFR and cQFR. However, among 504 lesions, 108 (21.4%) showed discordant results in the FFR and cQFR measurements when the threshold of 0.80 was used. cQFR, contrast-flow quantitative flow ratio; FFR, fractional flow reserve.
Characteristics of FFR+/cQFR− lesions
FFR+/cQFR− lesions showed significantly milder anatomical stenosis severity than FFR+/cQFR+ lesions (area stenosis: 59.2% vs 75.3%, respectively, p<0.01; diameter stenosis: 44.6% vs 57.3%, respectively, p<0.01) as well as a trend for shorter lesion length (18.0 vs 20.4 mm, respectively; p=0.15), similar subtended myocardial mass as indicated by the Duke jeopardy score (4.0 vs 4.0, respectively; p=0.46), significantly higher hyperaemic coronary flow velocity represented by a shorter mean transit time (Tmn) (0.22 vs 0.36, respectively; p<0.01), and a lower IMR (13.1 vs 18.8, respectively; p=0.011).
Characteristics of FFR−/cQFR+ lesions
FFR−/cQFR+ lesions showed significantly milder anatomical stenosis severity than FFR+/cQFR+ lesions (area stenosis: 71.1% vs 75.3%, respectively, p=0.011; diameter stenosis: 53.8% vs 57.3%, respectively, p=0.034), similar subtended myocardial mass fraction and physiological indices including coronary flow velocity represented as the inverse of Tmn.
Comparison between FFR+/cQFR− and FFR−/cQFR+ lesions
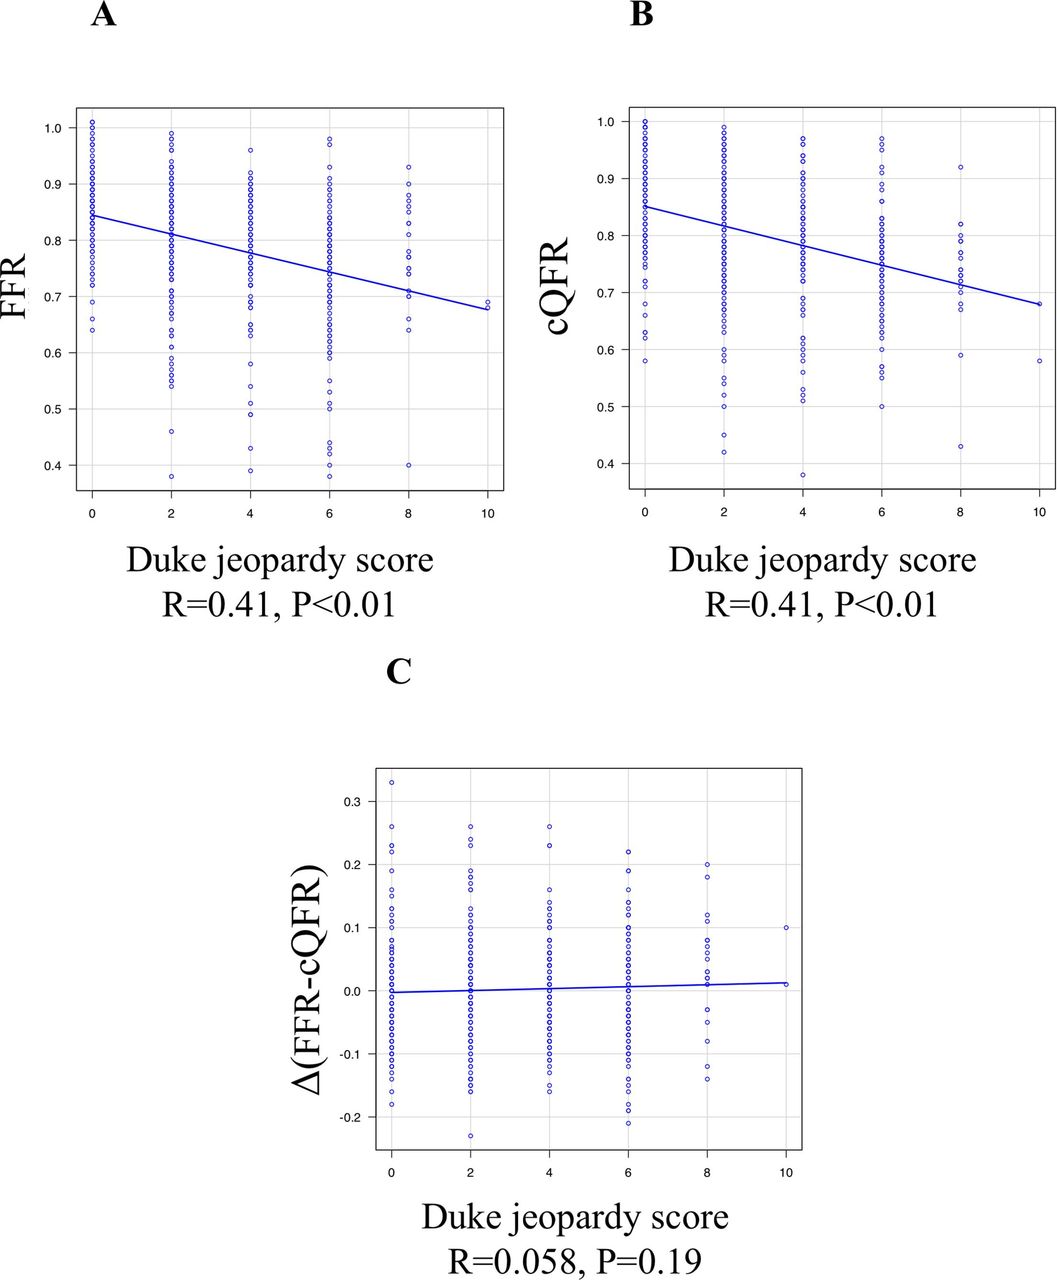
FFR−/cQFR+ lesions showed a significantly greater anatomical stenosis severity (area stenosis: 71.1% vs 59.2%, respectively, p<0.01), a significantly lower coronary flow velocity (Tmn: 0.33 vs 0.22, respectively; p=0.023), and a significantly higher IMR (22.1 vs 13.1, respectively; p<0.001) than FFR+/cQFR− lesions. Figure 3 shows the linear correlation between the difference in the FFR and cQFR measured as a function of the anatomical stenosis severity and the physiological and subtended myocardial mass indices. According to the current cQFR calculation algorithm, an increasing anatomical stenosis severity represented by the area stenosis or diameter stenosis was associated with increasing magnitudes of the difference between the FFR and cQFR (FFR >cQFR). Similarly, a decreasing coronary flow velocity (elongation of Tmn) was associated with increasing magnitudes of the difference between the FFR and cQFR. Increasing IMR values were associated with an increasing difference between the FFR and cQFR (R=0.19, p<0.01). In this cohort, no significant linear relationship was detected between the FFR and IMR (R=0.01, p=0.82), while a significant although weak relationship was found between the cQFR and IMR (R=0.15, p<0.01). Figure 4 shows the relationship between the Duke jeopardy score and FFR or cQFR. Both measures showed a significant relationship with the subtended cardiac mass (FFR: R=0.41, p<0.01 and cQFR: R=0.41, p<0.01), while no significant trend in the difference between the two measures was detected according to the increasing subtended cardiac mass.
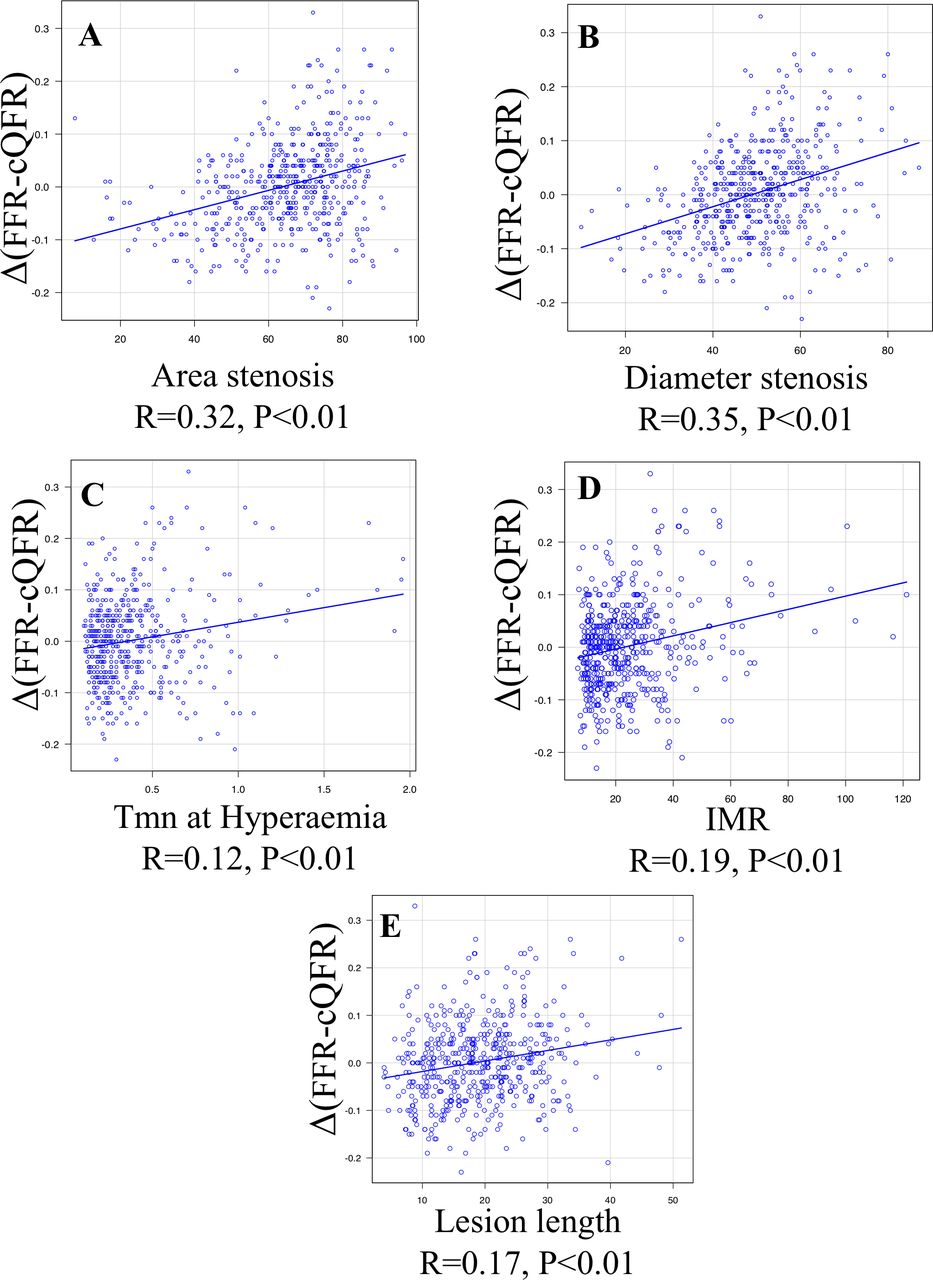
Linear correlation between difference in FFR/cQFR and anatomical stenosis severity and physiological and subtended myocardial mass indices. Scatter plot showing linear relationships between the difference in the FFR and cQFR and area stenosis (A), diameter stenosis (B), Tmn at hyperaemia (C), IMR (D) and lesion length (E). A significant association was documented in the FFR−cQFR difference and area stenosis, diameter stenosis, Tmn at hyperaemia, IMR and lesion length (all p<0.01). cQFR, contrast-flow quantitative flow ratio; FFR, fractional flow reserve; IMR, index of microcirculatory resistance.

Linear correlation between Duke jeopardy score and FFR, cQFR and difference between FFR and cQFR. Scatter plot showing liner relationship between Duke jeopardy score and FFR (A), cQFR (B) and the difference between FFR and cQFR (C). FFR and cQFR showed significant relationships with subtended cardiac mass, while FFR−cQFR difference was not associated with the jeopardised mass. cQFR, contrast-flow quantitative flow ratio; FFR, fractional flow reserve.
In total, 31 territories (6.2%; ‘jump out’ group) had an FFR above the upper limit of the grey zone (>0.80) and a cQFR below the lower limit (≤0.75). In contrast, five territories (1.0%; ‘jump in’ group) exhibited opposite results (FFR of ≤0.75 and cQFR of >0.80). The clinical and physiological findings of these territories are shown in table 3. The territories in the ‘jump out’ group showed significantly higher IMR values, lower coronary flow (elongation of Tmn) and longer lesion length (p<0.01 for all) than the territories in the ‘jump in’ group. The anatomical stenosis severity and subtended myocardial mass were similar between the groups.
Characteristics of ‘jump in’ and ‘jump out’ groups
The difference of diagnostic accuracy of cQFR between cQFR+ and cQFR− lesions stratified by IMR
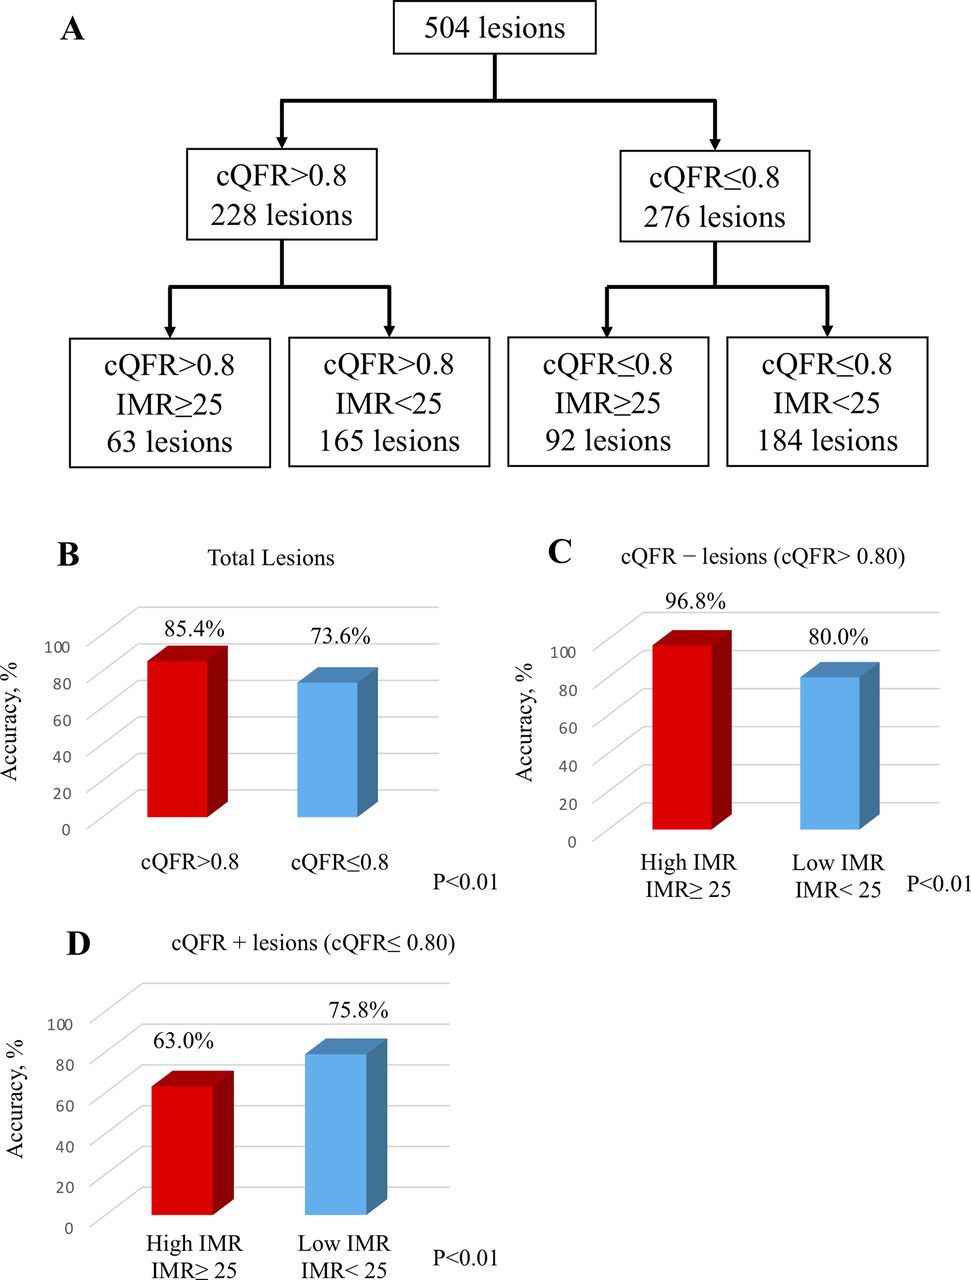
When categorising 228 cQFR− lesions into two subgroups according to the reported increased IMR threshold value of 2515 (low IMR group; 165 lesions, high IMR group; 63 lesions), the diagnostic accuracy of cQFR in low IMR group was significantly lower than that in high IMR group (high IMR; 96.8% and low IMR; 80.0%, p<0.01) (figure 5C). In contrast, when 276 cQFR+ lesions were categorised into two subgroups according to the IMR value of 25 (low IMR group; 184 lesions, high IMR group; 92 lesions), high IMR group was associated with significantly lower diagnostic accuracy of cQFR than in low IMR group (high IMR; 63.0% and low IMR; 75.8%, p<0.01) (figure 5D). In any subsets of these categorisations, cQFR consistently showed better diagnostic performance than angiographic assessments (cQFR–: 63.8%, cQFR+: 73.2%, cQFR–/high IMR: 82.5%, cQFR–/low IMR: 69.7%, cQFR+/high IMR: 56.5%, cQFR+/low IMR: 67.4%) (online supplementary file figure 1).
The difference in diagnostic accuracy in lesions classified by cQFR and IMR. (A) A total cohort was classified by cQFR and IMR. (B) The agreement between cQFR and FFR was better in cQFR− lesions. (C) The diagnostic accuracy was better in lesions with increased microvascular resistance in cQFR− lesions. (D) In cQFR+ lesions, increased microvascular resistance was associated with lower diagnostic accuracy. cQFR, contrast-flow quantitative flow ratio; IMR, index of microcirculatory resistance.
Discussion
The important findings of the present study are as follows. First, in the present cohort of patients with angiographically intermediate stenoses, discordance in the functional stenosis classification between FFR and cQFR was observed in 21.4% (108/504). Second, FFR+/cQFR− lesions showed significantly lower hyperaemic microvascular resistance, higher coronary flow velocity and significantly milder anatomical stenosis severity compared with FFR−/cQFR+ lesions, indicating a possibility of lesions similar to non-flow-limiting stenoses. Third, in the current cQFR calculation algorithm, increasing anatomical stenosis severity was associated with a greater difference between the FFR and cQFR (FFR >cQFR). Similarly, decreasing coronary flow velocity was associated with a greater difference between the FFR and cQFR (FFR >cQFR). Fourth, no significant linear relationship was detected between the FFR and IMR, while a significant although weak relationship was found between the cQFR and IMR. Increasing IMR values were associated with an increasing difference between the FFR and cQFR (FFR >cQFR). Fifth, both measures showed a significant relationship with the subtended cardiac mass, while no significant difference was detected in relation to an increasing subtended cardiac mass. Microvascular function bidirectionally influence cQFR diagnostic accuracy, indicating that decreased hyperaemic microvascular resistance lowered diagnostic performance of cQFR in cQFR− lesions, and increased microvascular resistance worsened accuracy in cQFR+ lesions. Finally, in 36 lesions (7.1%), which corresponded to about one-third of discordant functional assessment between FFR and cQFR in the present cohort, each measure jumped over the classification beyond the grey zone (0.75–0.80).
Our results suggest that the cQFR may be influenced more by increasing anatomical stenosis severity and microvascular function compared with the FFR. Since the flow rate represented by the TIMI frame count was taken into consideration in the integrated calculation algorithm, the value of cQFR decreased as the hyperaemic microvascular resistance increased. This may be an important feature of the cQFR in which coronary flow is integrated in the estimation of functional stenosis severity as well as three-dimensional anatomical stenosis severity in comparison with the FFR. Moreover, our results clearly indicate that the cQFR was associated with microvascular function as represented by the IMR. This is in contrast to the FFR, which reportedly has no significant relationship with the IMR, as was also shown in our study.16 Interestingly, however, unlike the difference in the relationships of the CFR with the FFR and iFR, the relationship between the cQFR and CFR was similar to that between the FFR and CFR (R=0.41, p<0.01 and R=0.41, p<0.01, respectively).17 Recently, Mejia-Renteria and Escaned et al reported that patients with coronary microvascular dysfunction showed significantly lower diagnostic performance of cQFR, compared with those without microvascular dysfunction.10 Our findings are partly in line with their results, indicating microvascular dysfunction (high IMR) lowered diagnostic performance of cQFR. We further demonstrated that decreased hyperaemic microvascular resistance represented by lower IMR similarly worsened classification agreement between FFR and cQFR. Therefore, our results extended their findings and showed that microvascular function represented by IMR bidirectionally influence cQFR diagnostic accuracy with FFR as a reference (figure 5C and D). Furthermore, in the present study, a significant relationship between myocardial mass and cQFR was documented. Importantly, we found that ‘jump out’ and ‘jump in’ groups, which jumped beyond the grey zone (0.75–0.80) into the opposite decision-making zone between FFR-guided and cQFR-guided decision-makings, existed in a non-negligible portion of patients.
We found that increasing IMR values were associated with an increasing difference between FFR and cQFR. Furthermore, our results indicated that an increasing anatomical stenosis severity represented by the area stenosis or diameter stenosis was associated with increasing magnitudes of the difference between the FFR and cQFR (FFR>cQFR), while both measures similarly showed a significant relationship with the subtended cardiac mass. Interestingly, no significant trend in the difference between the two measures was detected according to the increasing subtended cardiac mass. Of note, a decreasing coronary flow velocity (elongation of Tmn) was associated with increasing magnitudes of the difference between the FFR and cQFR, leading to the trend for FFR−/cQFR+ and lower CFR. Therefore, cQFR may be more dependent on the stenosis severity than invasive FFR in case of significant microvascular disease. Considering this basis, in territory of significant microvascular disease but with measurable epicardial coronary anatomical stenosis, the likelihood of demonstrating FFR−/cQFR+ might be higher than that of FFR+/cQFR−. Conversely, in territory of well-preserved vasodilatory capacity, represented by shorter hyperaemic Tmn and low IMR, induction of hyperaemia resulted in higher pressure gradient even in the milder stenosis and resulted in FFR+. In contrast, cQFR cannot fully account patient-specific coronary flow, and therefore, the likelihood of demonstrating FFR+/cQFR− lesions might be higher than that of FFR−/cQFR+. This is, at least, one of the reasons that the diagnostic performance of cQFR and the agreement with invasive FFR were different depending on the IMR values. When considering the prognostic importance of CFR and IMR in FFR-negative lesions, territories with FFR−/cQFR+ lesions might indicate high-risk group for future adverse cardiac events due to severe microvascular dysfunction and/or diffuse lesion with slow coronary flow even if these lesions may be deferred on the basis of FFR-guided decision-making.18 In addition, considering higher stenosis severity in FFR−/cQFR+ lesions, plaque burden would be high in these lesions.
Notably, the present study showed that both measures exhibited a ‘jumped-out’ functional classification beyond the grey zone in a non-negligible proportion of lesions (7.1% in the total cohort). The clinical population indicated for FFR-guided decision-making is predominantly based on the presence of intermediate lesions with FFR values showing a unimodal concentration close to the cut-off value of 0.80 or within the grey zone. In addition, measurement errors including technical imprecision and bias such as pressure drift can have an important effect on clinical decision-making regarding revascularisation, particularly in cases near the decision cut-off or close to the boundaries of the grey zone, and may affect the classification of patients for therapeutic management.14 19 We demonstrated that in 7.1% of lesions, which corresponded to about one-third of discordant functional assessment between FFR and cQFR in the present cohort, one metric was above the upper limit of the grey zone and the other was below the lower limit, which might raise a critical concern when using the cQFR as an interchangeable marker of the FFR during revascularisation decision-making or therapeutic management.
The FFR is determined both by the anatomical stenosis severity and by the amount of subtended myocardial mass distal to the lesion.20 Our results are in line with previous studies and showed that the FFR and cQFR were both significantly and similarly associated with the jeopardised myocardium, suggesting that the amount of myocardial mass subtended by a coronary stenosis is appropriately incorporated into the cQFR algorithm similar to the FFR.
The QFR computation was recently developed and validated to estimate the FFR value without pressure wire and pharmacologically induced hyperaemia. These are favourable aspects of QFR in the clinical practice. In addition, QFR measurements could shorten the procedure time and reduce wire-related cost and risks. However, discrepancy between the FFR-guided and cQFR-guided decision-making was documented in 20% of patients when the cut-off value of 0.80 was applied in the present study. Outcome date are still scarce, and further studies should clarify if cQFR-based decision-making is superior or non-inferior to FFR-based revascularisation decision-making. In addition, we could use QFR as a part of hybrid approach for decision-making without wire-based functional measurements.
As mentioned above, our study demonstrated that, in 36 (7.1%) lesions, in which the functional assessment jumped beyond the grey zone (0.75–0.80) into the opposite decision-making zones. This observation would be important, whereas there could be a potential to take full advantage of this feature to identify patients at high risk with slow coronary flow and high microvascular resistance that will lead to worse prognosis, even though these lesions have FFR>0.80.
Lesions with a discordant FFR and cQFR classification may need to be considered as a different functional and anatomical entity, not merely as an imprecision or technical error. Further studies are needed to elucidate whether these discordances can provide prognostic information.
Study limitations
The results of the present study should be interpreted with some limitations. This was a retrospective study and its inherent selection bias and limitations regarding the retrospective analysis of stored angiograms may exist. This might have also affected the accuracy of cQFR in the current study. Although care was taken to match the measurement points of the FFR and cQFR, small differences in location may have occurred in some cases. No outcome data were obtained to assess the clinical value of the cQFR. Further studies are required to elucidate whether the cQFR may provide a prognostic benefit compared with angiographic guidance or whether cQFR-guided revascularisation decision-making shows non-inferiority to FFR guidance.
Conclusions
Microvascular function and the anatomical stenosis severity were significantly associated with discordant FFR and cQFR values, while the subtended myocardial mass showed no impact on the difference between the FFR and cQFR. When using the FFR as a reference, the cQFR overestimated functional stenosis severity with increasing microvascular resistance and anatomical stenosis severity. Microvascular function bidirectionally influenced classification agreement between FFR and cQFR according to functional significance of lesions. Care should be taken when the cQFR is used for revascularisation decision-making because the cQFR and FFR values may result in completely different decisions beyond the grey zone in more than one-third of discordant classifications between two measures.
Acknowledgments
We thank all the physicians, nurses, other catheter laboratory staff members and patients involved in this study.
References
Footnotes
Contributors YKanno designed the study, and wrote the initial draft of the manuscript. TK, TS, MHo and RH contributed to analysis and interpretation of data, and assisted in the preparation of the manuscript. All other authors have contributed to data collection and interpretation, and critically reviewed the manuscript. All authors approved the final version of the manuscript, and agreed to be accountable for all aspects of the work in ensuring that questions related to the accuracy or integrity of any part of the work are appropriately investigated and resolved.
Funding The authors have not declared a specific grant for this research from any funding agency in the public, commercial or not-for-profit sectors.
Competing interests None declared.
Patient consent for publication Not required.
Provenance and peer review Not commissioned; externally peer reviewed.
Data availability statement Data are available upon reasonable request.