Article Text

Abstract
Background Hypertrophic cardiomyopathy (HCM) is associated with an increased risk of adverse cardiac events. Beyond classic risk factors, relative myocardial ischaemia and succeeding myocardial alterations, which can be detected using either contrast agents or parametric mapping in cardiovascular magnetic resonance (CMR) imaging, have shown an impact on outcome in HCM. CMR may help to risk stratify using parametric T2* mapping. Therefore, the aim of the present study was to evaluate the association of T2* values or fibrosis with cardiovascular events in HCM.
Methods The relationship between T2* with supraventricular, ventricular arrhythmia or heart failure was retrospectively assessed in 91 patients with HCM referred for CMR on a 1.5T MR imaging system. Fibrosis as a reference was added to the model. Patients were subdivided into groups according to T2* value quartiles.
Results 47 patients experienced an event of ventricular arrhythmia, 25 of atrial fibrillation/flutter and 17 of heart failure. T2*≤28.7 ms yielded no association with ventricular events in the whole HCM cohort. T2* of non-obstructive HCM showed a significant association with ventricular events in univariate analysis, but not in multivariate analysis. For the combined endpoint of arrhythmic events, there was already an association for the whole HCM cohort, but again only in univariate analyses. Fibrosis stayed the strongest predictor in all analyses. There was no association for T2* and fibrosis with heart failure.
Conclusions Decreased T2* values by CMR only provide a small association with arrhythmic events in HCM, especially in non-obstructive HCM. No information is added for heart failure.
- MRI
- ventricular hypertrophy
- myocardial ischaemia and infarction (IHD)
- myocardial fibrosis
- arrhythmias
This is an open access article distributed in accordance with the Creative Commons Attribution Non Commercial (CC BY-NC 4.0) license, which permits others to distribute, remix, adapt, build upon this work non-commercially, and license their derivative works on different terms, provided the original work is properly cited, appropriate credit is given, any changes made indicated, and the use is non-commercial. See: http://creativecommons.org/licenses/by-nc/4.0/.
Statistics from Altmetric.com
Key questions
What is already known about this subject?
Beyond classic risk factors, relative myocardial ischaemia and succeeding myocardial alterations have shown an impact on outcome in hypertrophic cardiomyopathy (HCM). These alterations can either be detected using contrast agents or parametric mapping in cardiovascular magnetic resonance (CMR) imaging. In particular, CMR T2* mapping can detect these alterations and may help to risk stratify cardiovascular events in HCM.
What does this study add?
In this study, the relationship between T2* with supraventricular, ventricular arrhythmia or heart failure was retrospectively assessed in 91 patients with HCM referred for CMR. Fibrosis as a reference was added to the model. Decreased T2* values by CMR only provide a small association with arrhythmic events in HCM, especially in non-obstructive HCM with T2* values ≤28.7 ms. No information is added for heart failure.
How might this impact on clinical practice?
Myocardial fibrosis by late gadolinium enhancement remained the strongest predictor indicating that T2* mapping may only be used in certain clinical settings. In this context, decreased T2* values by CMR may provide a small association with arrhythmic events in HCM, especially for non-obstructive HCM.
Background
Hypertrophic cardiomyopathy (HCM) is a frequent cause of sudden cardiac death (SCD).1–3 Despite a common macroscopic, morphological endpoint with increasing left ventricular mass (LVM) and wall thickness, HCM is characterised by heterogeneous pathophysiological substrates.4 This heterogeneity can be triggered by myocardial ischaemic reactions caused by a relative mismatch of myocardial demand and coronary blood supply.4–6 Over time, relative myocardial ischaemia is thought to trigger a varying degree of myocardial oedema, cell death, and fibrosis.
Although the disease may show a benign course, the ischaemic cascade in HCM shows an impact on prognosis.7 8 To determine the risk of future cardiovascular events, common risk stratification models include a variety of markers, for example, severity of LV hypertrophy (LVH) or non-sustained ventricular tachycardia (nsVT).4 Although this model has proven useful in risk stratification, it does not identify all patients with HCM at risk. Cardiovascular magnetic resonance (CMR) has emerged as a diagnostic tool for the ongoing search of additional risk factors in order to improve risk stratification9 10 and recent investigations have revealed relative ischaemia and fibrosis as potential predictors to cardiovascular events in HCM.6 8 11 12
CMR is able to detect myocardial alterations and relative ischaemia using contrast agent and parametric mapping.6 13–15 In particular, T2* mapping has proven feasibility to detect ischaemic segments in extracardiac organs but also in myocardial infarction and coronary artery disease (CAD).15–21 Reduced T2* values have been described in patients with HCM potentially triggered through relative ischaemia.22 As relative ischaemia seems to be related to a worse prognosis, the aim of this study was to assess the relation of myocardial T2* mapping by CMR with the occurrence of arrhythmia or heart failure (HF) in patients with HCM. As known prognostic markers, fibrosis and troponin T were taken into the model for comparison.
Methods
The study was conducted in accordance with the Declaration of Helsinki and its later amendments. All data used for this study were acquired for clinical purposes and handled anonymously. This retrospective study had ethics committee approval of the Ethics Committee of the Canton of Zurich. Written informed consent was waived by the Institutional Review Board.
Study population
In total, 91 patients (age 49.9±16.8 years) with HCM were retrospectively included in this study from June 2012 to May 2018. The patients were referred for clinical evaluation in our hypertrophic cardiomyopathy outpatient clinic and diagnosed with the disease according to the 2014 European Society of Cardiology (ESC) Guidelines4 with otherwise unexplained LVH and/or a maximal wall thickness ≥15 mm. Forty-five patients (49%) had an obstructive form with significant left ventricular outflow tract (LVOT) obstruction with either a resting or provocable gradient ≥30 mm Hg on transthoracic echocardiography (TTE). Due to an influence of CAD on T2* values, patients with relevant CAD, determined by invasive catheter coronary angiography or non-invasive imaging, were excluded.15 All patients with HCM underwent CMR. Clinical data were obtained by review of medical records. Patients were followed according to a specified care track with yearly ECG, blood work, TTE, Holter monitor and CMR every 3–5 years.
Diagnostic criteria for study endpoints
Ventricular arrhythmias ranging from nsVT to SCD events and/or atrial fibrillation/flutter as well as HF were chosen as single or as a combined (arrhythmic) endpoint. Atrial fibrillation/flutter and ventricular arrhythmias were diagnosed either on resting ECG, Holter or during device interrogation. NsVTs were defined as ≥3 ventricular beats at a rate >100 bpm, sustained VT as duration of >30 s and SCD events as follows: unexpected sudden collapse within 1 hour from the onset of symptoms in patients with a previous stable clinical course.12 23 24 In addition, successful resuscitation from cardiac arrest or an appropriate intervention from an implantable cardioverter defibrillator (ICD) was regarded as SCD-equivalent. HF was defined as progression to New York Heart Association (NYHA) class III or IV in the absence of LVOT obstruction, left ventricular ejection fraction (LVEF) <50% or hospitalisation due to HF complications.8
Besides T2* values and fibrosis, troponin T was obtained as an additional parameter during routine examination around the time of the CMR and a value >0.014 ng/mL was considered elevated according to laboratory standards.
Cardiovascular magnetic resonance
CMR was performed on a 1.5T MRI System (Achieva, Philips) using a five-channel phased-array coil. Functional and geometric assessment was performed using balanced cine steady-state free precession (SSFP) images in standard long-axis geometries (two-chamber, three-chamber and four-chamber view) as well as in short-axis orientation with full ventricular coverage from base to apex (repetition time (TR)/echo time (TE)= 3.3/1.6 ms, flip angle (FA) = 60°, spatial resolution = 1.5×1.5×8 mm3, 50 phases, two slices per breath-hold).15
T2* mapping was performed using a single breath-hold multiecho fast field-echo sequence in one short-axis midventricular slice at end-diastole (six echoes with shortest interecho spacing, TR: 13 ms, TE: 3 ms, flip angle 35°, acquired spatial resolution 1.6×2.8×8 mm3, bandwidth 781 Hz/pixel).15 If applicable (glomerular filtration rate >30 mL/min), gadolinium-based contrast agent (Gadovist, Bayer Healthcare) was administered at doses of 0.2 mmol/kg for late gadolinium-enhanced imaging (LGE). After 10 min, a three-dimensional gradient spoiled turbo fast-field-echo sequence with a non-selective 180° inversion pre-pulse was acquired at end-diastole with anatomical reference taken from balanced SSFP images.25
Postprocessing
Postprocessing was performed using commercial software (IntelliSpace Portal, Philips). Short-axis and long-axis slices were analysed covering maximum end-diastolic interventricular septum thickness (IVS), left ventricular indexed end-diastolic volume (LVEDVi), LVEF and indexed LVM (LVMi).
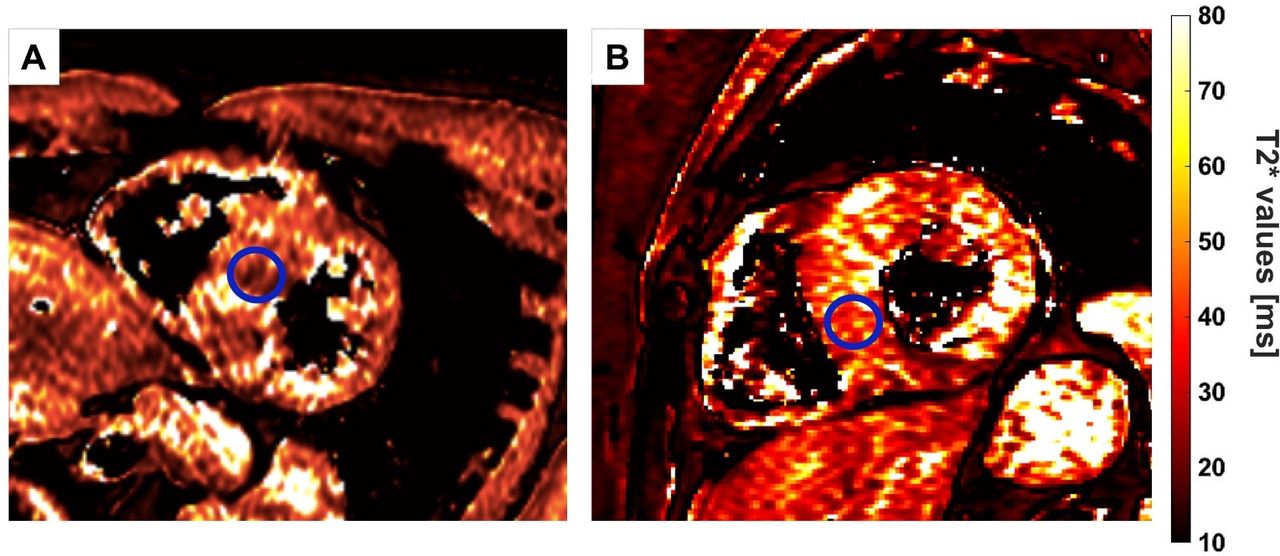
T2* sequences were postprocessed according to recent guidelines as follows: a region of interest (ROI) was manually drawn at a midventricular level using a standardised ROI size (≈50 mm2) and visually avoiding partial volume effects at epicardial boarders as recommended in recent guidelines (figure 1).20 This has been shown feasible in previous studies in addition to avoid susceptibility artefacts. For every ROI, the time constant of the signal intensity decay over all echoes was derived using a mono-exponential decay-curve. Afterwards, average T2* values and SD for this ROI were calculated and colour-coded using a spectral look-up table.

Placing of the ROI in a T2* map of a patients with T2* values below (A) and above (B) the fourth quartile. ROI, region of interest.
Fibrosis was assessed semiautomatically. Images with LGE were evaluated as follows: epicardial and endocardial contours of the short-axis LGE images in every slice were drawn manually and the amount of fibrosis as a percentage of LVMi was calculated by using a full-width at half-maximum algorithm.26
Statistical analysis
Statistical analysis was performed using SPSS (V.24.0). Unless otherwise stated, continuous variables are presented as mean±SD. Normal distribution was tested using the Shapiro-Wilk test for the comparison of CMR parameters between patients with (HOCM) and without (HNCM) outflow tract obstruction. Data between the two different groups were analysed by two-sided unpaired Student t-tests for normally distributed data and Mann-Whitney U-test for not normally distributed data. The χ2 test or Fisher exact test was used to examine significant differences between nominal classifications.
In the first approach, the whole collective of patients with HCM was taken for statistical analyses. Afterwards patients were divided into HOCM and HNCM. T2* values were divided into quartiles (≤25%, 26%–50%, 51%–75%, >75%). Troponin T and the presence of fibrosis were entered into the model as well. To evaluate, whether T2* may predict the overall occurrence of the different arrhythmia groups or HF, univariate and multivariate binomial logistic regression models were calculated in which the event of arrhythmia or HF was entered as dependent variable and T2* values (either below the first quartile as cut-off or below the fourth quartile as cut-off), fibrosis and troponin T as independent variables. The multivariate model was constructed using a forward regression model with an entrance and stay criteria of p<0.1. For reasons of clarification, p values of excluded variables are reported as well.
Results
Patient population and CMR T2*
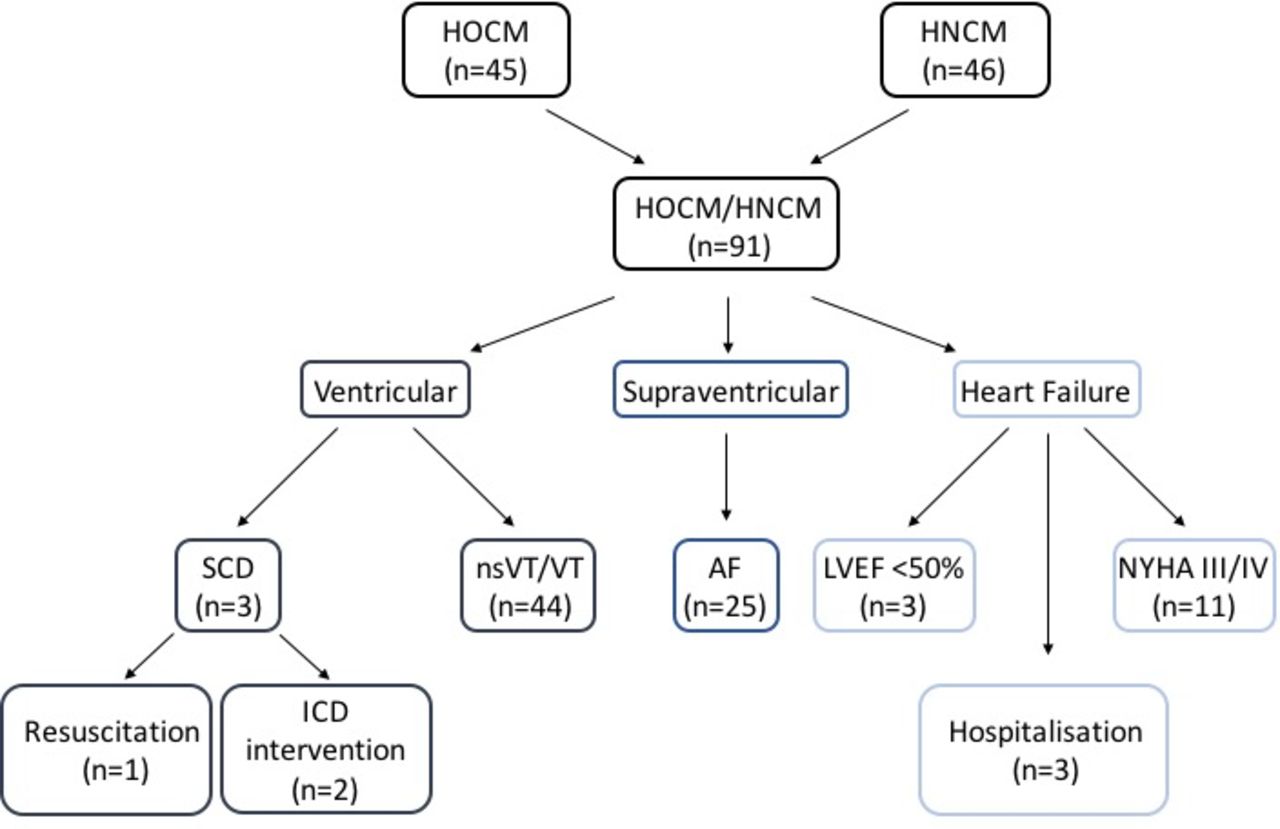
Clinical baseline characteristics are summarised in table 1A. The mean observation period was 1236.6±943.3 days. Overall, 47 (49%) patients experienced ventricular events with 3 (6%) patients surviving a SCD (figure 2). Twenty-five (27%) patients exhibited atrial fibrillation/flutter. Seventeen patients (19%) presented with HF of which 3 (3%) had an LVEF <50%, 3 (3%) were hospitalised due to HF complications and 11 (12%) progressed into NYHA class III.

Study diagram with numbers indicating the occurrence of ventricular, supraventricular events and heart failure. AF, atrial fibrillation/flutter; HNCM, hypertrophic non-obstructive cardiomyopathy; HOCM, hypertrophic obstructive cardiomyopathy; ICD, implantable cardioverter defibrillator; LVEF, left ventricularejection fraction; nsVT, non-sustained ventricular tachycardia; NYHA, New York Heart Association; SCD, sudden cardiac death; VT, ventricular fibrillation/tachycardia.
Clinical (A) and CMR (B) baseline characteristics.
CMR characteristics of all HCM are summarised in table 1B. According to quartile analyses, 23 patients presented with a T2* value ≤23.3 ms (first quartile), 23 patients presented with T2* values between 23.4 and 26.2 ms (second quartile), 23 patients presented with T2* values between 26.3 and 28.7 ms (third quartile) and 22 patients presented with T2* values >28.7 ms (fourth quartile) (exemplary maps in figure 1). Troponin T was elevated in 33 (36%, 9 values missing) patients and fibrosis was present in 66 (73%) of all CMR analyses. Fibrosis extent ranged from 1% to 38% (mean: 10.1%±9.2%).
Ventricular arrhythmia
The incidence of ventricular arrhythmia in the different quartiles of HCM is summarised in table 2.
Incidence of endpoints divided into the quartiles of T2* values
In univariate binomial regression calculations independent from the onset of ventricular arrhythmia, only fibrosis and troponin T, but not T2*, were associated with an increased risk of arrhythmia (table 3A). In multivariate analysis, fibrosis stayed the only independent predictor (p=0.004, OR=5.29).
Results for the binomial logistic regression analysis of the relation between T2*, troponin T, fibrosis and ventricular events/SCD in the group of HCM (A) as well as in the subgroup of HNCM (B)
In a second approach, patients were divided into HOCM and HCM. According to the ESC Guidelines on HCM, 45 patients (49%) had a diagnosis of HOCM.4 There was no significant difference in T2* values between both groups (table 1B).
Binomial regression showed that patients with HNCM with a T2*≤28.7 (p=0.033) or fibrosis (p=0.014) had the greatest association with ventricular events (table 3B). Fibrosis stayed the only independent predictor in multivariate analyses (p=0.039, OR=10.2).
For HOCM, neither T2*, fibrosis nor troponin T revealed a significant association with ventricular arrhythmias.
Atrial fibrillation/flutter
The incidence and number of included patients into the subanalyses of atrial fibrillation/flutter are summarised in table 2. Neither the whole cohort, nor the division into HNCM or HOCM revealed a significant association between T2* values, fibrosis, troponin T and atrial fibrillation/flutter in regression analyses.
Combined arrhythmic endpoint
For a combined endpoint of ventricular and supraventricular events, univariate binomial logistic regression calculations revealed an association of T2*≤28.7 ms (p=0.047) or fibrosis (p=0.007) with an increased risk of arrhythmia (table 4A). In multivariate analysis, fibrosis stayed the only independent predictor (p=0.015, OR=3.59).
Results for the binomial regression analyses of the relation between T2*, troponin T, fibrosis and ventricular events/atrial fibrillation/flutter as combined endpoint in the group of HCM (A) as well as in the subgroup of HNCM (B)
Dividing the whole cohort according to HOCM and HNCM, binomial regression showed that patients with HNCM with a T2*≤28.7 (p=0.032) or fibrosis (p=0.016) had the greatest association with arrhythmic events (table 4b). However, fibrosis stayed the only predictor in multivariate analyses (p=0.052, OR=5.73).
For HOCM, no parameter revealed a significant association with the combined endpoint of arrhythmia.
Heart failure
The incidence of HF in the different quartiles of HCM is summarised in table 2. Although a significant difference between the T2* quartile groups was indicated, no significant influence of T2*, fibrosis or troponin T in the whole cohort as well as divided according to HOCM/HNCM could be detected (table 5).
Results in the whole group of HCM for the binomial regression analyses of the relation between T2*, troponin T, fibrosis and heart failure
Discussion
Although commonly used for predicting adverse cardiovascular events, current risk stratification models for HCM using a combination of clinical and imaging parameters are limited in identifying all patients, mainly as a result of the heterogeneity of the disease.3 12 27 As adverse events may occur in patients with HCM that are considered at low risk, there is a need to identify additional markers.2
CMR is recommended a class IB indication in patients with HCM and interest has emerged to improve risk stratification models using CMR parameters.4 In this context, one focus has been on the cascade of myocardial ischaemic reactions. The presence of relative ischaemia has already shown to influence the prognosis of patients with HCM on either arrhythmic events or HF.8 28 In CMR, myocardial ischaemia and fibrosis can be imaged using contrast agents or using parametric mapping on the basis of magnetic relaxation properties.14 29 In particular, T2* mapping is able to characterise the relaxation of the transverse magnetisation that is influenced by macroscopic (inhomogeneities of the magnetic field) and mesoscopic (structure of the tissue) magnetic field inhomogeneities.14 20 In this context, reduced T2* values have already shown the potential to describe structural alterations suggestive of ischaemic alterations, collagen areas or haemorrhage in cardiac and extracardiac tissues.15 18 21 According to this, histopathological substrates of T2* and a correlation of T2* to flow analyses have been studied.16 17 19 20 30 Recently, reduced T2* values have been described in a group of patients with HCM potentially triggered through relative ischaemia.22 Another explanation for the reduction of T2* values could be that in areas of reduced perfusion, oxymyoglobin and haemoglobin as oxygen suppliers are decreased, whereas deoxymyoglobin and haemoglobin are increased. In contrast to oxygenated proteins, deoxygenated proteins are paramagnetic and reduce local T2* values. However, further studies will have to confirm the potential substrates for a T2* reduction.
In the present study, patients with HCM showed a varying degree of myocardial T2* values, which supports previous studies that showed heterogeneity in myocardial ischaemic reactions.12 Therefore, individual cut-offs to predict arrhythmic events could be chosen according to quartiles. T2* mapping in the present study was not designed to detect myocardial iron overload that can further decrease T2*-values with an impact on the prognosis of patients with thalassemia major. No further division below 23.4 ms was made.31
Only the endpoint of ventricular arrhythmia alone was associated with T2* values in patients with HNCM in univariate analyses. Combining arrhythmic events, there was an association between T2* and arrhythmic events of the whole HCM cohort. None could be detected for HF. Assuming T2* values to be influenced by relative ischaemia, previous studies have already detected an association of abnormal T2 signal as a sign for myocardial damage and arrhythmia.32 33 In general, the results of the additional parameter of fibrosis were in line with previous studies showing an increased risk of events for patients with fibrosis.12 28 34 One should note that fibrosis, which was measured covering the whole heart, stayed the strongest predictor for arrhythmic events in patients with HCM throughout univariate and multivariate analyses. Whole heart coverage using T2* is not recommended in recent guidelines due to susceptibility artefacts at the epicardial borders of the heart.20 As T2* has shown reduced values in patients with HCM and fibrosis, current analyses of the association of T2* with cardiac events in HCM possibly support results for fibrosis without the need for contrast agent, but with less clear results. This is further supported that T2* and fibrosis showed no linear correlation. Therefore, T2* values may be of potential value in cases of doubt or when patients with HCM are not eligible for contrast administration.
Especially patients with HNCM exhibited an association between T2* values and ventricular arrhythmia or a combined endpoint, but only in univariate analyses. Taking conventional risk stratification models that include LV wall thickness and LVOT gradient, those patients would have been graded to be at lower risk.4 However, the overall significance could have been hampered due to low numbers in the subgroups.
Comparing the patients below the third quartile in common risk stratification parameters, one should note that thickened IVS and HOCM occurrence were significantly higher in patients with reduced T2* values. However, T2* values did not show a correlation to thickened IVS, elevated LVMi or age. As a consequence, T2* may potentially identify additional patients with a higher risk of arrhythmia that were considered at low risk for cardiac events using previous risk model estimations.4 35 It should be noted that higher T2* values do not preclude future cardiac events, suggesting further influencing factors that should be taken into account.8
The study was conducted as a retrospective, single-centre study. Therefore, the size of our study population, especially in subanalyses, must be acknowledged as one limitation and was the reason to only perform logistic regression. Prospective multicentre studies using longer follow-up periods and more patients should be used to further evaluate the influence of T2*.
Owing to our study design, patients with ICD or confirmed CAD had to be excluded, thereby potentially introducing some study bias.
Finally, LGE was not further subdivided according to the extent in % of affected LVMi as those data have already been published before.12
Perfusion sequences and parametric T1* mapping with extracellular volume measurements would have been of additional value to quantify relative ischaemia without the use of contrast agents. Nevertheless, LGE remains still one of the gold standards for the detection of fibrosis.
Conclusions
Decreased T2* values by CMR only provide a small association with arrhythmic events in HCM, especially for HNCM. However, within most analyses, myocardial fibrosis by LGE remained the strongest predictor indicating that T2* may be used as additional marker in certain clinical settings.
Acknowledgments
The authors acknowledge the support of staff at the Department of Cardiology, University Heart Center, and Institute of Diagnostic and Interventional Radiology, University Hospital Zurich.
References
Footnotes
Contributors MG, AG, JVS, MP: acquired the CMR data. MG: performed statistical analyses. CG, KL: contributed in statistical analyses. MG and RM: wrote the main manuscript. CG, KL, AG, JVS, MP, FB, MK, FR, HA, SK: contributed in discussions. All authors reviewed the manuscript.
Funding This work was supported by a grant from the German Research Foundation (DFG) Research Fellowship (GA 2621/1-1).
Competing interests None declared.
Patient consent for publication Not required.
Ethics approval Written informed consent was waived by the Institutional Review Board.
Provenance and peer review Not commissioned; externally peer reviewed.
Data availability statement Data are available upon reasonable request. All data used in this manuscript can be made available upon reasonable request from the first or last author. If made available, data will be deidentified.