Article Text

Statistics from Altmetric.com
The main function of the left atrium is to connect the pulmonary circulation with the corresponding ventricle, acting as a reservoir, during atrial filling, when the mitral valve is closed, as a booster, when the atrial contraction ensues, but especially acting as a conduit, during diastasis. Accordingly, the atrial cavity has, in the past, been assigned the minimalistic role of a ‘transit chamber’, devoted exclusively to collecting and redirecting the reflux blood from the pulmonary district towards the systemic circulation. It would be wrong, however, to deduce from this ‘pipeline’ function that the left atrium is a passive player in the complex scenario of the cardiac activity.
Left atrial cavity, in fact, is intimately related to ventricular function throughout the whole cardiac cycle.1 During ventricular systole, longitudinal fibre shortening forces the descent of the cardiac base, contributing to atrial filling from the pulmonary veins2 while, during diastole, the atrium passively and actively contributes to ventricular filling. Since the cavity, during early and mid-diastole, is directly exposed to the ventricular pressure through the open mitral valve, the atrial emptying pattern is obviously strongly influenced by the left heart diastolic properties.3
Atrial function can be best described by the relation between pressure and volume.4 Gathering this information, however, implies the use of a high-fidelity pressure catheter in the atrial chamber, a manoeuvre that is not performed routinely nowadays in clinical practice. A more simplistic way to describe atrial function is to rely on the atrial volume curve, which can easily be obtained nowdays using three-dimensional (3D) echocardiography.5
It must be emphasised, however, that the atrial volume curve does not provide an exact measure of the amount of blood entering the left ventricle from the atrium during diastole. In the phase of passive atrial emptying and atrial diastasis, in fact, blood also flows from the pulmonary veins to the ventricle. Furthermore, during active atrial emptying, some blood may flow back into the pulmonary veins. It is only the simultaneous availability of the left atrial and left ventricular volume curves that allows a precise definition of the contribution of the left atrium to the ventricular filling process.6
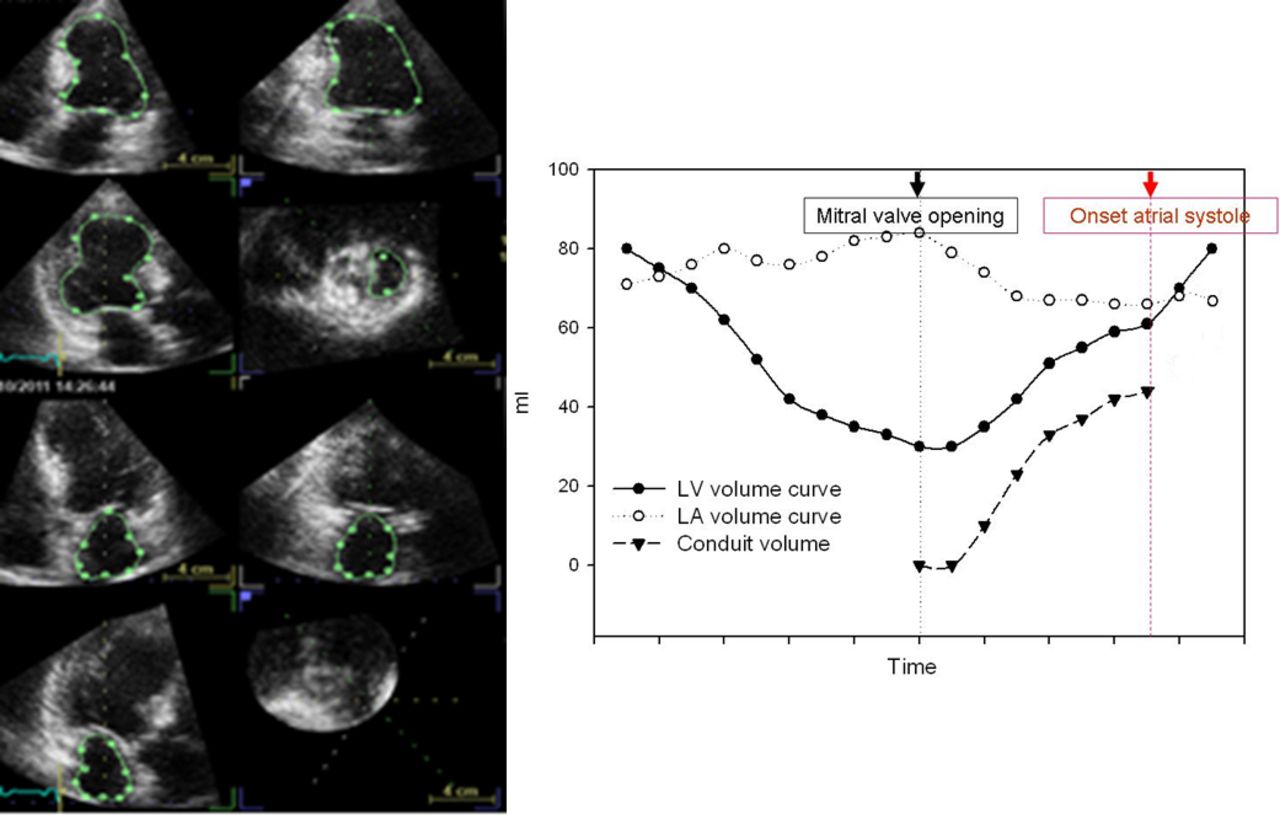
Recently, in characterising the governing role of the four-chamber (near) constant-volume pump physiology, wherein the atrial and ventricular volumes simultaneously reciprocate throughout the cardiac cycle, MRI has elucidated and characterised the left atrial and ventricular phasic function, thereby quantifying the conduit contribution to ventricular filling as the integral of net, diastolic, instantaneous difference between synchronised atrial and ventricular volume curves.7 In the simplest terms, because the ventricular systolic ejection volume is greater than the volume that simultaneously enters the atrial cavity during systole, the difference between systolic ejected and entering volumes is made up in the next diastole, during the E-wave acceleration–deceleration, defining the left atrial conduit volume (LACV). Because cardiac MRI availability is limited, we employed 3D echocardiography to acquire complete and simultaneous left atrial and ventricular full-volume datasets to characterise the volume of both left-sided cardiac chambers at each time point during the cardiac cycle in order to quantify LACV (figure 1, modified from ref 8).

(Left) Pyramidal three-dimensional echocardiographic full-volume dataset acquired from the apex in a given patient using a 3 V transducer. The volume data can be displayed in real time: three orthogonal apical views and one cross-sectional slice, with optional volume rendering techniques. (Right) Continuous ventricular, atrial and conduit volume curves in a given patient. LA, left atrial; LV, left ventricular.
Data were collected in patients after a recent hospital admission for congestive heart failure. The results demonstrate that conduit, quantified according to the formula: LACV=[left ventricular volume (t) – left ventricular volume minimum] – [left atrial volume maximal – left atrial volume (t)],7 integrating volume data from minimum ventricular volume to the beginning of the atrial contraction (as identified from simultaneously acquired ECG signal) and expressed as percent of ventricular stroke volume, can be assessed from 3D echocardiography, and the results favourably compare with MRI.8
Conduit
The conduit phase sees the atrium acting as a simple conduit that transits blood towards the underlying ventricle. This function is reciprocal of the other two atrial functions at the various stages of ventricular diastolic dysfunction (DD). Unlike reservoir and pump functions, in fact, conduit makes little contribution to ventricular stroke volume in the initial stages of DD, but this contribution gains importance in the advanced stages of the disease, when the role of the other two phasic functions diminishes.8–10 In the advanced DD stages, due to the increase in late diastolic pressure, in fact, greater importance is attributed to the ventricular fast filling early diastolic phase, with a shortening of the filling period and an increase of the early peak E wave velocity.11 At this point, the reservoir-pump function is clearly exhausted, while the conduit function takes prevalence.
Conduit flow from the pulmonary reservoir during diastole assures cyclic restoration of four-chamber volume to its presystolic level, the atrial cavity behaving as a constant pressure source for ventricular filling due to a combination of conduit and capacitance function.12 13 Such considerations support interpreting atrial conduit phasic function as a component of ventricular stroke volume in conditions of increased resistance to filling and explain why LACV contribution to filling volume will increase with worsening DD.
Conduit flow commences when mitral valve opens and terminates before atrial contraction (figure 1).14 Mechanical ventricular recoil is the energy source that initiates the E wave and the simultaneous Doppler D wave through the pulmonary veins.15 Accordingly, such phasic function might be more appropriately viewed, in normal subjects, as a ventricular diastolic function attribute, rather than reflecting intrinsic atrial characteristics.16
Recent MRI data, however, contrast this interpretation, at least in the pathological DD condition. Von Roeder et al,17 in an elegant study, demonstrated that impaired LA conduit function represents a distinct feature of heart failure preserved ejection fraction (HFpEF), independent of ventricular relaxation and stiffness. They performed cardiac magnetic resonance feature tracking in 22 patients with HFpEF and in 12 patients without HFpEF. Left atrial reservoir, conduit and booster pump strain were quantified. Peak oxygen uptake (VO2max) was determined, while invasive pressure–volume loops were obtained to evaluate left ventricular diastolic properties. Early ventricular filling was determined from ventricular time–volume curves as obtained from cardiac MRI.
Atrial reservoir and conduit strain were impaired (significantly reduced) in HFpEF patients (p=0.04 and p<0.01, respectively) as compared with patients without HFpEF. The HFpEF population also showed lower oxygen uptake (p<0.01). Authors demonstrate that strain measurement for left atrial conduit function is strongly associated with VO2max (p<0.01), besides acting as the strongest predictor for VO2max (p<0.01) on multivariable regression analysis, even after inclusion of ventricular stiffness and relaxation time. They conclude that, in HFpEF patients, conduit function reflects intrinsic atrial pathology, which cannot be sufficiently explained by ventricular pathology only.17
Although Von Roeder et al used strain to assess conduit, and not volumetric data, nor they did relate atrial to the simultaneous ventricular strain behaviour in order to contextualise atrial to ventricular mechanics in diastole (so-called atrioventricular coupling), their work clearly underlines the strong association, in pathology, between conduit and impaired early ventricular filling. Their work also points in the direction of an important role of intrinsic atrial properties in generating conduit function which, if not independent, is at least only marginally explained by parameters describing the ventricular diastolic condition.17
One year before Zakeri et al 18 had described the presence of left atrial chamber and myocyte hypertrophy, with enhanced atrial contractile function, compared with controls, in an invasive canine model reflecting early-stage HFpEF comprising advanced age, renal-induced hypertension and aldosterone excess. Furthermore, those authors noticed that left atrioventricular coupling was impaired and chamber atrial compliance was reduced, in association with lower ventricular stroke volume. Thus, impaired atrial compliance could provide a plausible mechanism for the observed deranged atrial conduit strain and compromised peak VO2max in the Von Roeder’s study,19 advancing the concept of an early intrinsic atrial myopathy in the genesis of HFpEF.20
Atrial stiffness and its role in heart failure
The physiological significance of atrial stiffness is not completely understood, but some indirect evidence does suggest that it is important in haemodynamics. It is well known, in fact, that the addition of a flexible atrium to the inlet of an artificial heart substantially improves the heart’s output.21 Conversely, an increase in atrial stiffness should reduce stroke volume and cardiac output.22
Accordingly, we did demonstrate, in a study conducted in 15 instrumented patients during open heart surgery (significant coronary artery disease in seven patients, associated with aortic valve replacement in three, mitral valve repair in one or isolated aortic valve disease in four subjects), that average atrial operative stiffness (Kla), computed as invasively estimated △ atrial pressure/Doppler echo-derived △ atrial cavity volume during the reservoir phase, was inversely related to cardiac index (r=−0.69, p<0.01) and obviously to stroke volume.13
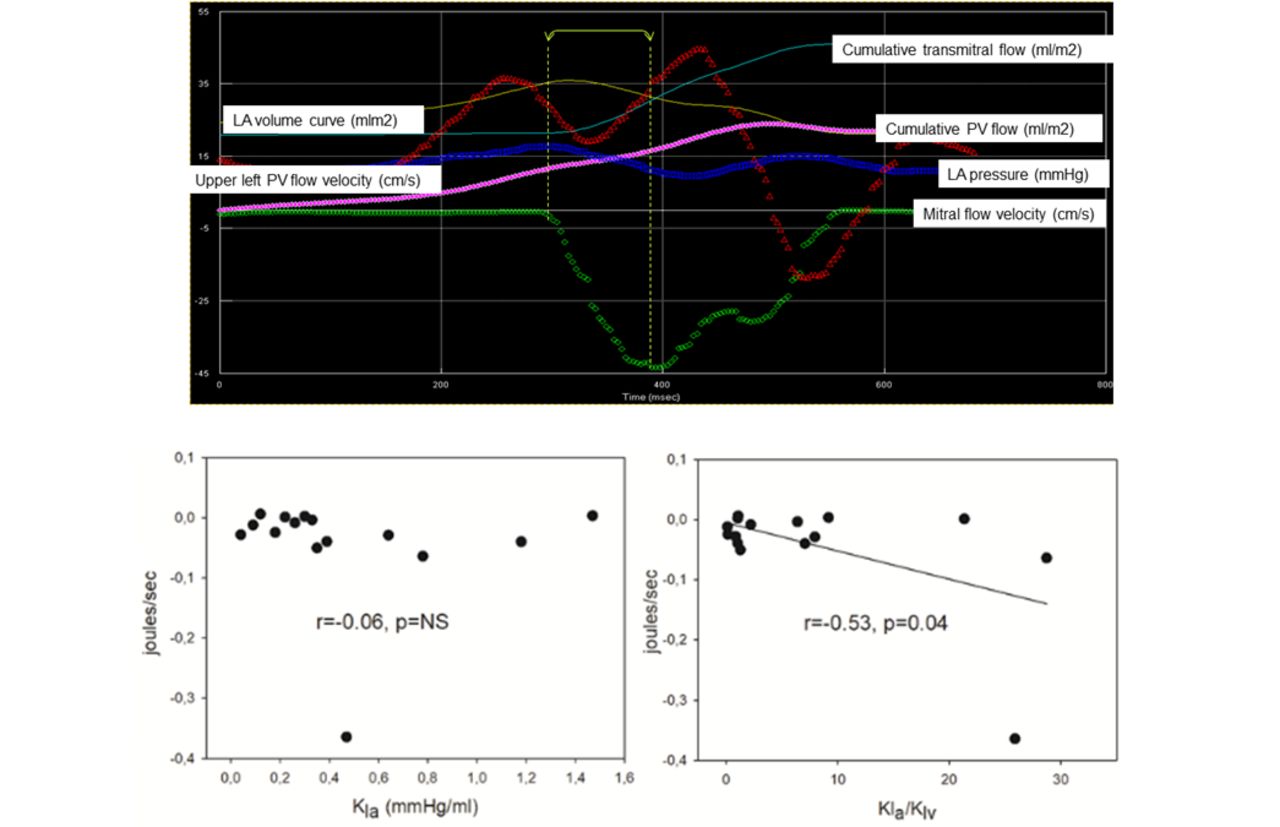
Further intriguing, however, in that study was the observation that the ratio between Kla and ventricular stiffness (Klv), computed from mitral valve deceleration time according to the formula proposed by Little et al 11: Klv= (70/(deceleration time in ms-20))∧2,11 rather than atrial stiffness ‘per se’, modulated the expansion wave associated with pulmonary vein flow in early diastole (figure 2).

(Top) An example of a transesophageally instrumented patient during open-heart surgery. Mitral and upper pulmonary vein (PV) flow velocity (cm/s), together with left atrial (LA) pressure (mm Hg) are shown. Mitral and PV cumulative flow (ml/m2), besides the LA volume curve (ml/m2), are also shown. (Bottom) Product of each time point change in atrial pressure versus pulmonary vein flow integrated over the mitral acceleration time interval is plotted versus LA stiffness (Kla) (left) and the ratio of Kla/Klv (left ventricular stiffness) (right). The relation is significant only for Kla/Klv.
Such energy transfer was quantified for the 15 patients reported above as the area described by the product of the change in atrial pressure versus change in pulmonary vein flow velocity integrated over the mitral acceleration time interval in early diastole.23 Thus, it may be postulated that, in pathology, conduit flow is associated with an early diastolic expansion wave that is a function of the ratio of the stiffness of the atrial relative to the ventricular cavity (Kla/Klv), rather than of atrial stiffness (Kla) ‘per se’.
Conduit in atrial fibrillation and cardioversion
Experimental data obtained from a dog model of congestive heart failure induced by up to 5-week tachypacing clearly demonstrate that there was more fibrosis in the left atrium (10%±1%) than in left ventricle (0.4%±0.1%, p<0.01) at the end of the experiment.24 In this regard, it is reported that the atrium is particularly prone to fibrosis, more than 20-fold as compared with the ventricle. Ventricular tachypacing, in fact, causes tissue apoptosis, inflammatory cell infiltration and cell death, with maximum changes in the atrium being faster and larger than in the ventricle.25
These experimental findings, which suggest that there is considerably higher resistance of ventricular myocardium to structural remodelling as compared with the atria,24 together with the widely disseminated concept that structural atrial reshaping begets atrial fibrillation, motivated us to look at the relation between conduit and the atrioventricular coupling in a group of 38 persistently fibrillating patients (aged 70.6±9.0 years, body mass index 29.7±3.8 kg/m2), as derived from a composite patients’ population obtained from two recently published studies.26 27 For these patients, conduit data, as assessed using 3D echocardiography full-volume atrioventricular datasets, were available pre-electrical and immediately postelectrical cardioversion (table 1).
Clinical and echocardiographic parameters considered for the combined patients’ population before and immediately after ECV
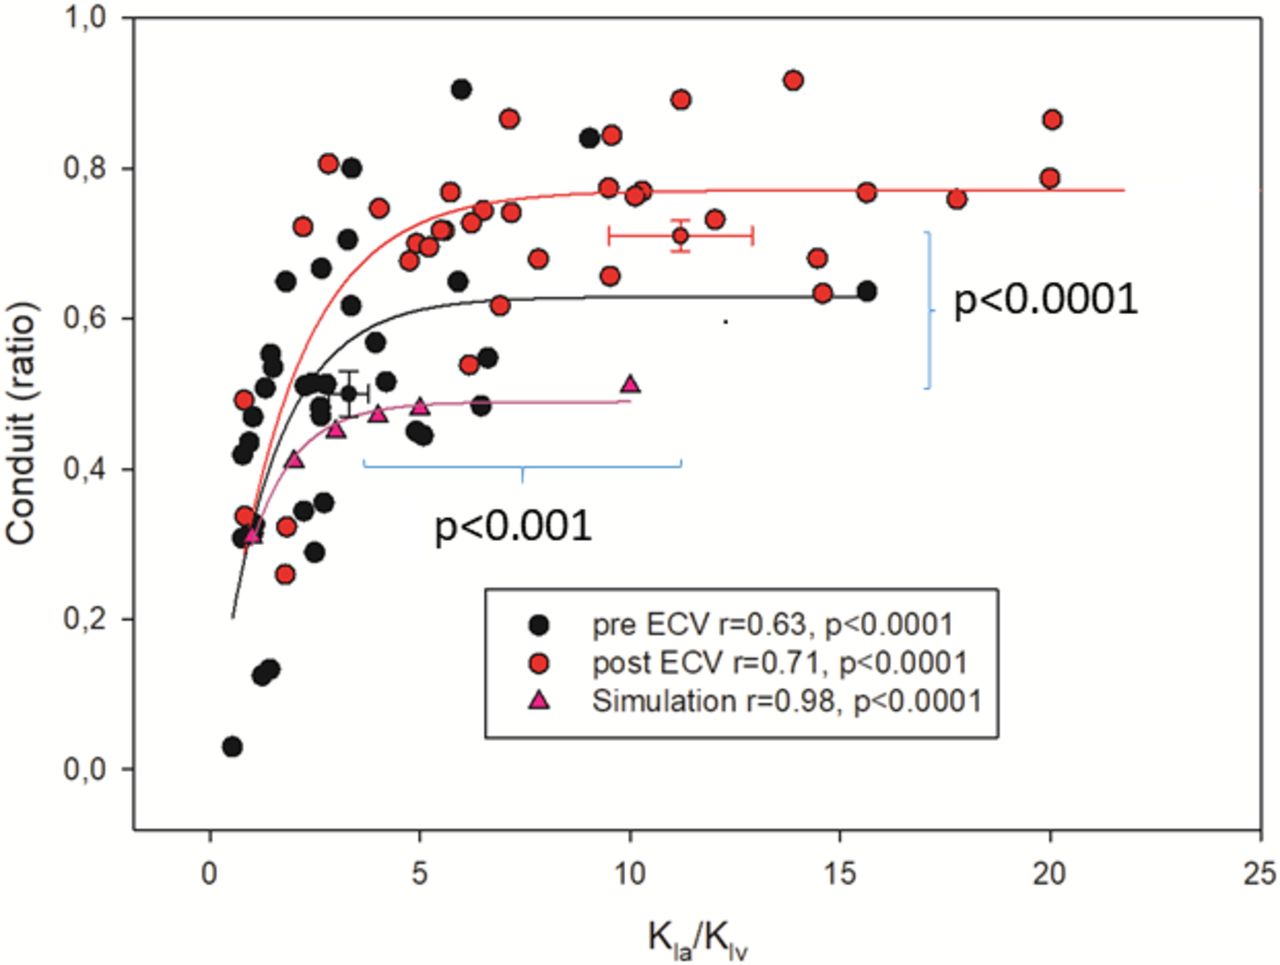
Figure 3, obtained from that database, suggests that there is a curvilinear relation between conduit (normalised to ventricular stroke volume) and the ratio between noninvasively assessed atrial and ventricular stiffness, with atrial stiffness (Kla) computed as end-diastolic ventricular pressure (EDP=11.96+0.596*E/é28) divided by atrial reservoir in millilitres and ventricular stiffness (Klv) calculated from the mitral valve deceleration time according to Little et al.11 Theoretical conduit data, as derived from a published model simulation where seven Kla/Klv ratios could be generated (1/1; 2/1; 3/1; 4/1; 5/1;10/1;15/1), are also represented for comparison.29

Dispersion plot of conduit (y-axis), normalised to left ventricular stroke volume, and (x-axis) the ratio between noninvasively estimated atrial and ventricular stiffness (Kla/Klv) in a population of persistently fibrillating patients imaged before and soon after electrical cardioversion. Figure suggests that there is a curvilinear relation between conduit and Kla/Klv, with conduit plateauing for stiffness ratios >10/1. Theoretical conduit data, as derived from a published model simulation where seven Kla/Klv ratios could be generated (1/1; 2/1; 3/1; 4/1; 5/1;10/1;15/1)29 29 are also represented for comparison. See text for further comments. Data are mean+SE.
The dispersion plot shows a reasonable coincidence between measured and theoretical values, with conduit flow systematically overestimating simulated data and plateauing for stiffness ratios >10/1. Thus, conduit quantification seems to have the potential of depicting the diastolic atrioventricular coupling scenario, with conduit increasing in a condition of progressively unfavourable coupling as represented by higher values of Kla/Klv ratio. It is also interesting to note that regular rhythm restoration, right after electrical cardioversion when atrial stunning minimises the cavity’s ability to pump, significantly increases the conduit contribution to ventricular filling, together with some increments in Kla/Klv.
The reasons for these findings are not obvious, but they could be related, as far as the Kla/Klv ratio rise, to the elongation of the mitral deceleration time that we recorded immediately after the procedure (table 1). If mitral deceleration time prolongs after cardioversion, by definition, Klv computation decreases, determining some increment in the Kla/Klv ratio. What persists unclear, however, is why conduit increases 22%±17% (p<0.001) postcardioversion (figure 3). We think that this may be due to some acute not significant atrial reverse remodelling that intervenes soon after regular rhythm restoration, which modulates stiffening of the cavity further contributing to the net increment of the Kla/Klv ratio. In any case, surprisingly, atrial strain improves (more positive) postcardioversion (table 1) in antithesis with what we would expect looking at the atrial reservoir volumetric data.
These data suggest potential dissociation between deformation versus volumetric phasic atrial data, with an explanation that is not straightforward. Several previous studies have demonstrated that the technique of speckle-tracking for measuring strain is a valuable method in order to investigate atrial function.30 For example, the multi-ethnic study of atherosclerosis (MESA) study,31 using MRI, has proven that strain analysis is accurate in predicting atrial functional deterioration. However, use of echocardiographic strain can be hampered by regional inhomogeneity of deformation during contraction and relaxation, particularly along the posterior wall, because of the attachment of the pulmonary veins.32 Furthermore, in our database, strain data were generated using only a single beat apical four-chamber view acquisition.26 27 All these caveats, together with the fact that atrial and ventricular stiffness are computed non-invasively, may contribute to the discrepancy we noted for atrial deformation versus volumetric cavity behaviour in the present analysis.
According to table 1 atrial strain increases after cardioversion, together with the simultaneous improvement of the cavity dyssynchrony, as reflected by the reduction of the SD of time-to-peak (TP-SD) of individual deformations of six segments automatically located along the perimeter of the atrium and normalised to R–R interval.33 This finding may well justify the improvement in atrial strain notwithstanding the reduction in the reservoir volume of the cavity, questioning the real capacity of strain of interpreting mechanistically the scenario precardioversion/postcardioversion.34
Conclusion
Quantification of conduit using 3D echocardiography full-volume atrioventricular datasets in the everyday diagnostic echocardiographic routine is worthwhile, as it conveys a non-invasive unique ‘fresco’ of the impredictable atrioventricular coupling condition, which is modulated to a various extent by the atrial and the ventricular cavity properties, besides their ratio. The short learning curve and easiness associated with conduit correct quantification in the clinical imaging laboratory makes this parameter a promising tool in the complex process of diagnostic DD stratification algorithm. If conduit will survive within the competing armamentarium of non-invasive instrumental parameters, aiming at characterising cardiac diastole is a matter of future debate.35
References
Footnotes
Contributors Al authors contributed to the data collection and analysis. Furthermore, they all provided intellectual contribution and approved the concepts expressed in the manuscript.
Competing interests None declared.
Patient consent for publication Not required.
Provenance and peer review Not commissioned; externally peer reviewed.
Data availability statement Data are available upon reasonable request.