Article Text

Abstract
Objective Wave intensity analysis is a method that allows separating pulse waves into components generated proximally and in the periphery of arterial trees, as well as characterising them as accelerating or decelerating. The early diastolic suction wave (eaDSW) is one of the most prominent wave events in the coronaries. The aim of this study was to determine whether (1) microvascular dilatation directly influences its energy, (2) stenosis severity can be assessed proximal to stenoses, (3) distal pulse wave entrapment exists in the presence of stenoses and (4) coronary collaterals influence wave entrapment.
Methods In 43 coronary artery disease patients, Doppler flow velocity and pressure measurements were performed in a proximal coronary segment at rest, in a distal segment at rest, during adenosine-induced hyperaemia and during balloon occlusion. Wave energies were calculated as the area under the wave intensity curves.
Results The eaDSW energy showed a significant increase during hyperaemia, but did not differ between proximal and distal segments. There was no significant correlation between eaDSW energy and coronary stenosis severity. Pulse wave entrapment could not be observed consistently in the distal segments. Consequently, the effect of coronary collaterals on pulse wave entrapment could not be studied.
Conclusions Microvascular dilation in the coronary circulation increases distal eaDSW energy. However, it does not show any diagnostically useful variation between measurement sites, various stenosis degrees and amount of collateral flow. The assessment eaDSW and its reflections were not useful for the quantification of coronary stenosis severity or the collateral circulation in clinical practice.
- coronary haemodynamics
- coronary artery disease
- wave intensity analysis
- coronary stenosis
- coronary collateral circulation
This is an open access article distributed in accordance with the Creative Commons Attribution Non Commercial (CC BY-NC 4.0) license, which permits others to distribute, remix, adapt, build upon this work non-commercially, and license their derivative works on different terms, provided the original work is properly cited, appropriate credit is given, any changes made indicated, and the use is non-commercial. See: http://creativecommons.org/licenses/by-nc/4.0/.
Statistics from Altmetric.com
- coronary haemodynamics
- coronary artery disease
- wave intensity analysis
- coronary stenosis
- coronary collateral circulation
Key questions
What is already known about this subject?
Wave intensity analysis (WIA) is a well-established method for the characterisation and quantification of pulse waves in tubular structures. In coronary arteries, several studies have been performed in the past, mostly in the context of conditions other than stable coronary artery disease.
What does this study add?
The current study was, therefore, performed to comprehensively assess the influence of coronary stenoses and the collateral circulation on the most important coronary pulse wave event, that is, the early diastolic suction wave (eaDSW). We found that the energy of this wave correlates with peripheral coronary vasomotor activity, but no significant relations could be established with stenosis severity and amount of collateral flow.
How might this impact on clinical practice?
We, therefore, conclude that under the currently available measurement techniques, the assessment of the eaDSW using WIA does not provide enough useful physiological information for future clinical diagnostic tools.
Introduction
While pulse wave propagation phenomena in the systemic circulation have been studied extensively in the past decade,1–8 only limited information is available from the coronary artery tree despite its crucial role for morbidity and mortality worldwide.9 The reason may not only lie in the more difficult access to perform measurements, but also in the more complex nature of pulse wave propagation phenomena in the coronaries. While in the systemic arteries, pulse wave energy is generated proximally by cardiac ejection and all other waves represent passive reflections within the branching tree, the pulse waves in the coronary arteries are produced by both, cardiac ejection and compression/decompression of the myocardial microcirculation. This results in an additional pulse wave energy source located in the periphery of the arterial tree that must be taken into account. Wave intensity analysis (WIA) is a method that allows separating pulse waves into components generated proximally and in the periphery of the arterial tree.10 Furthermore, accelerating and decelerating components can also be identified separately, thus providing useful insight into the source and nature of the coronary pulse wave phenomena. Since coronary blood flow is predominantly diastolic, the main pulse wave event responsible for fluid acceleration is an early diastolic accelerating or suction wave (figure 1).11 The energy source of this pulse wave originates in the periphery from the decompression of the coronary microcirculation during myocardial relaxation, resulting in a suction effect. It has been shown that left ventricular relaxation properties directly influence the amount of this early diastolic suction wave (eaDSW).12 WIA also allows for precise temporal allocation of pulse wave events. This has led to the identification of a pulse wave-free period at mid-diastole when a linear pressure-flow relationship prevails. This has allowed the development of the instantaneous wave-free reserve method, an alternative tool to assess haemodynamic coronary stenosis severity that—unlike fractional flow reserve (FFR)—does not require myocardial hyperaemia,13 and that is now increasingly being implemented in coronary functional diagnostics. In the systemic circulation, it is well-established that pulse waves are reflected at sites of impedance mismatch, such as arterial bifurcations and calibre changes.2 4 In the coronary artery tree, stenoses constitute such mismatch sites, but peripheral pulse wave reflections—potentially leading to their entrapment downstream of stenoses—have not been studied in humans.

Signal acquisition and processing. The three top panels show the original signals as recorded in the coronary artery. The middle panel on the right depicts the wave intensity curves (positive curve: wave originating proximally, negative curve: wave originating distally, blue: decelerating wave, green: accelerating wave). The early diastolic suction wave is marked with a black arrow. The two lower panels show the process of signal superposition used to retrieve an average pressure and flow velocity curve (bold black curves in the lower right panel). For temporal signal alignment, the ECG is used (lower left panel). PU-loop = pressure-velocity-loop
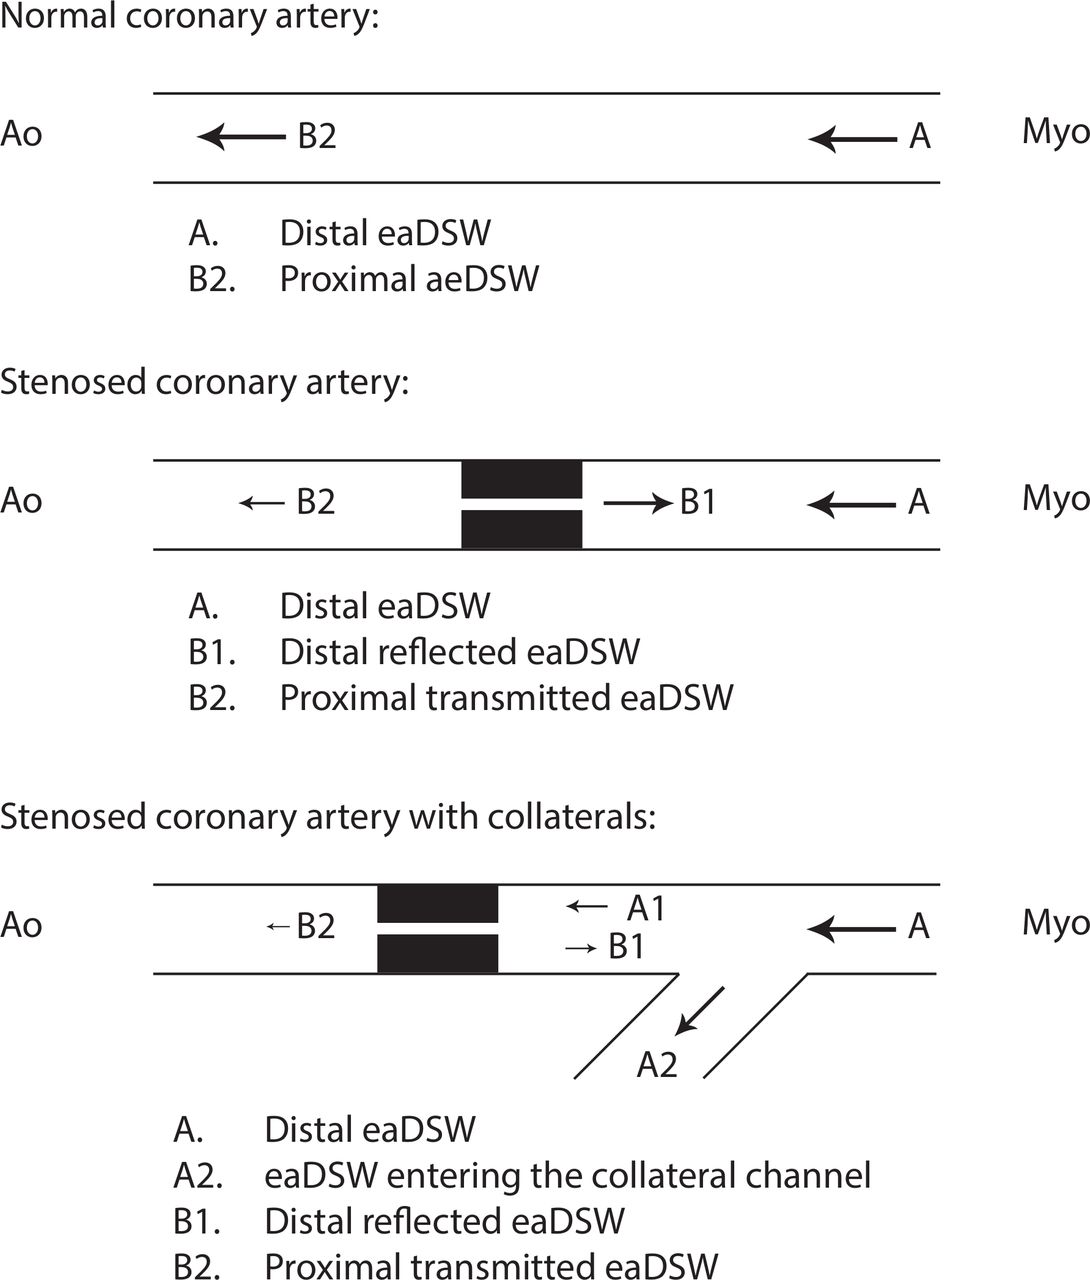
The focus of this study was to characterise the eaDSW in a broad range of coronary stenosis severity, and to determine whether (1) microvascular dilatation directly influences its energy, (2) stenosis severity can be assessed proximal to the stenosis, which could prevent the crossing of the stenosis with a guidewire, (3) distal pulse wave entrapment phenomena can be observed in the presence of significant stenoses and (4) coronary collaterals influence these entrapment phenomena. An illustration of these hypotheses is shown in figure 2.

Expected wave phenomena in normal and stenosed coronary arteries with and without coronary collaterals. The early diastolic suction wave (eaDSW) is generated distally and travels backwards. In normal coronary arteries, no significant obstruction exists along with its path towards the aorta. In stenosed coronary arteries, we expected a distal reflection of the suction wave, generating a forward travelling decompression wave. In the presence of coronary collaterals, such distal pulse wave entrapment phenomena were expected to be attenuated (ie, collaterals acting as escape channels). In coronary segments proximal to the stenosis, we expected an attenuation of the eaDSW, depending on the degree of stenosis. The arrows indicate the expected wave travel direction, whereas the arrow size indicates the expected wave energy. All waves in this illustration were expected to preserve their decompressive nature, that is, accelerating blood when backward-travelling, and decelerating blood when forward-travelling. Ao, aorta; Myo, myocardium.
Methods
The primary endpoint was eaDSW energy as assessed using WIA. Secondary endpoints were total forward and backward wave energy, early diastolic forward suction wave (peripheral wave reflection at stenosis sites).
Patient population
Forty-three patients were included without limitations regarding coronary stenosis severity, ranging from absent to severe. Inclusion criteria were: patients referred for coronary angiography in the context of chest pain, age≥18 years, stable cardiopulmonary conditions and written informed consent to participate in the study. Exclusion criteria were: patients referred to emergency coronary intervention, prior myocardial infarction, history of adverse reaction to adenosine, atrioventricular block grade II or III, sick sinus syndrome, severe mitral or aortic valve disease, severe chronic obstructive pulmonary disease, history of bronchial asthma and known bleeding diathesis.
Protocol and invasive procedure
Coronary angiography was performed using 6F coronary guiding catheters. The catheter was inserted in the ostium of the coronary artery under investigation. Doppler and pressure signals were measured simultaneously using combined Doppler-sensor/pressure-sensor angioplasty guidewires (ComboWire). The wire was connected to a ComboMap interface able to visualise and route the incoming signals (both, Volcano Therapeutics, San Diego, California, USA).
The guidewire was introduced into the coronary ostium for initial calibration purposes. A sequence of five signal recordings of approximately 30 s duration was performed, starting with the proximal coronary segment. The guidewire was then placed in a distal segment (distal to the stenosis if present) and recording was performed under resting conditions, during intracoronary adenosine-induced hyperaemia and a 1 min proximal coronary balloon occlusion. Subsequently, all therapeutic interventions (including stent placement) were performed if clinically indicated. A final measurement was taken in the ascending aorta for intersignal delay correction purposes (see section Correction of intersignal delay) after removal of the catheter from the coronary ostium.
Data logging
The ComboMap was equipped with analogue outputs for aortic pressure (derived from the fluid-filled catheter), coronary pressure and Doppler-derived instantaneous peak flow velocity signals. These signals, including an ECG and central venous pressure (CVP), were digitised at a sampling frequency of 500 Hz using a NI cDAQ-9172 system equipped with a NI 9206 A/D-converter module (National Instruments, Austin, Texas, USA). Signal storage on PC was performed by a customised data logging software written in LabVIEW V.8.5 platform (National Instruments).14 All external equipment and wiring were installed and tested for medical applications meeting the requirements defined in the international norms IEC 60601 for electrical safety and electromagnetic compatibility.
Offline signal processing and analyses
Offline signal processing and physiological measurements were performed on a customised WIA analysis software written in Matlab V.7 platform (The MathWorks, Natick, Massachusetts, USA). A screenshot of the user interface was modified for illustration purposes and is depicted in figure 1.
FFR and coronary flow velocity reserve
FFR and coronary flow velocity reserve (CFVR) were assessed using intracoronary adenosine bolus injection at a dose of 18 µg for the left coronary artery and 12 µg for the right coronary artery before balloon dilation of the coronary stenosis. FFR was calculated as the ratio of mean distal pressure to mean aortic pressure under maximal hyperaemia.15 CFVR was calculated as the ratio of average peak flow velocity during maximal hyperaemia divided by resting condition.
Pressure-derived and Doppler-derived collateral flow indices
Collateral function was assessed using both, pressure and Doppler signals, as previously described.16 Pressure-derived collateral flow index was calculated from simultaneously obtained mean occlusive coronary pressure (Poccl), mean aortic pressure (Pao) and mean CVP. Doppler velocity-derived collateral flow index (CFIv) was calculated from the average peak flow velocity of the distal Doppler signal during occlusion normalised by the value obtained before occlusion.
Wave intensity analysis
WIA is derived from applying the law of mass-conservation and momentum-conservation to the one-dimensional wave equation, and from constituting a tube law. The partial differential equations are solved using the method of characteristic. The resulting ‘water hammer equation’ defines the relation between pressure (dP) and flow velocity (dU) changes for the forward-propagating (f) and backward-propagating (b) pulse waves separately. Any given pressure and flow velocity waveform can, thus, be separated into components determined by pulse waves travelling in opposite directions.10 To calculate the pulse wave propagation velocity c, the so-called Sigma-Square-Method was applied.12 17 The additional separation of the pulse waves into its flow-accelerating and flow-decelerating components is determined by the sign of the flow velocity change dU. Each intensity curve was displayed separately. The wave intensity curves were retrieved from pressure and velocity signals averaged over approximately 30 s. This averaging required an ECG R-wave detection for precise temporal alignment of the signal portions of one cardiac cycle length each. The signal portions were then superimposed and averaged (figure 1). Prior to averaging, the original pressure and velocity signals were filtered with the use of a Savitzky-Golay filter for high-frequency noise reduction. All premature beats were excluded from averaging. A signal-to-noise ratio (SNR) was derived as the ratio between the amplitude of the averaged signal and the mean-variance of the underlying superimposed signals. At an SNR lower than 2, the signal quality was labelled insufficient. These signals were not excluded from the analyses because small amplitudes were frequently encountered and are physiological particularly during coronary occlusion.
The parameters retrieved from the intracoronary wave intensity curves included: the energy of the eaDSW, the total coronary wave energy (all four wave components during the entire cardiac cycle) and the total backward-propagating and forward-propagating wave energy separately. All wave energies were computed from the time integral of the wave intensity curve (area under the curve). The eaDSW reserve was calculated as the ratio between hyperaemia and resting condition.
The reflection of the eaDSW at the distal end of the coronary stenosis was expected to generate a forward-travelling decompression wave immediately after the onset of the original wave, that is, in early diastole. The decompressive nature of these reflected waves was derived from the assumption that the reflection coefficient is positive at a site of luminal narrowing.
Correction of intersignal delay
Due to different signal-processing stages within the ComboMap interface, the velocity signal is delayed at the output compared with the pressure signal. An intersignal delay correction procedure, therefore, had to be performed. We developed a delay measurement system with the help of a calibrated syringe. Comparisons with measurements in the ascending aorta have shown that the in vivo method for delay correction is sufficiently accurate.14 The velocity signal was shifted backwards until the early systolic upstroke of the pressure-velocity-loop resulted in the best possible linear relationship, that is, in a maximum correlation coefficient between pressure and velocity.4 Only the initial reflection-free period in the ascending aorta was considered for this procedure.
Other measurements
Offline biplane quantitative geometrical evaluation of stenoses was performed on Inturis for Cardiology (Pie Medical Imaging, Maastricht, the Netherlands), yielding per cent diameter stenosis. CVP was measured using a fluid-filled 5F pig-tail catheter placed in the right atrium. Left ventricular ejection fraction was assessed from left ventricular angiography.
Statistical analysis
Continuous variables are given as mean±SD. Intraindividual comparisons of eaDSW energy were performed using repeated measures analysis of variance (ANOVA). Post hoc comparisons were performed using a Bonferroni correction. Comparisons between two continuous variables were conducted using linear regression analysis. Interindividual comparisons were performed by an unpaired student’s t-test. A p value<0.05 was considered statistically significant. For the ANOVA post hoc comparisons, a p value<0.01 was considered statistically significant.
Results
Patient characteristics
A total of 50 patients gave written informed consent, and in 43 patients, the study protocol could be accomplished. The reasons for the dropouts were: more complex than expected coronary intervention in four cases, coronary dissection during stent implantation in one case, technical problems with the signal acquisition in one case and data loss in one case. Mean age was 65±9 years, 54% were men. Baseline characteristics are listed in table 1.
Patient baseline characteristics
Stenosis severity ranged from 0% to 100% diameter reduction (figure 3).

Stenosis severity distribution, as assessed by biplane quantitative coronary angiography (QCA).
Doppler velocity signal quality
SNR of the instantaneous peak flow velocity signals showed a large range. The SNR values are given in table 2. The most consistent signals were recorded in the proximal segment at rest and in the distal segments during hyperaemia, whereas during occlusion, the signal was most prone to noise.
Signal-to-noise ratio (SNR) of flow velocity tracings
eaDSW energy
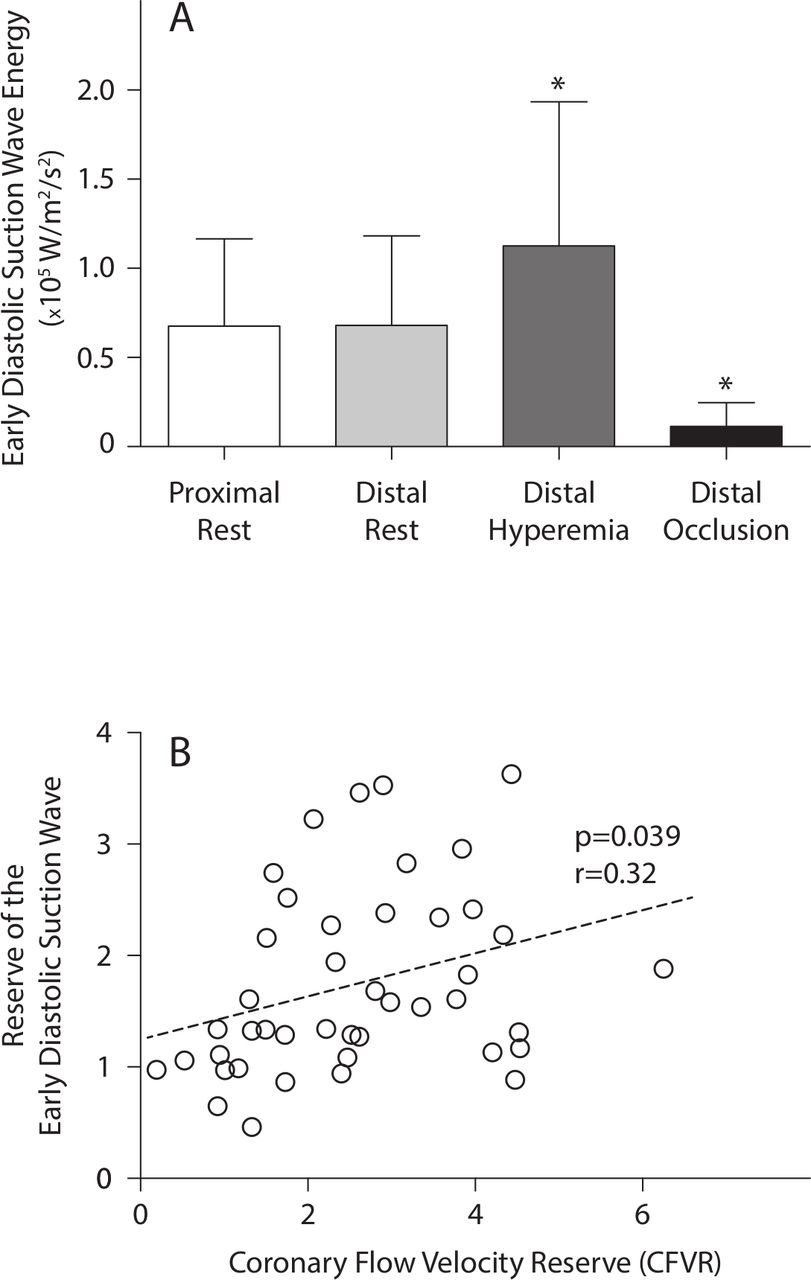
The eaDSW energy showed significant differences depending on adenosine injection and balloon occlusion (ANOVA F=27.5, r2=0.48, p<0.0001, figure 4). It did not differ between proximal and distal coronary segments at rest, but showed a significant increase during adenosine-induced hyperaemia (+4’450 W/m2/s2, p<0.01), and a significant decrease during coronary occlusion (−10’120 W/m2/s, p<0.01). There was a linear relationship between CFVR and the reserve of the eaDSW (figure 4). There was no significant correlation between the distal eaDSW and all three measures of coronary stenosis severity, that is, per cent stenosis (biplane quantitative coronary angiography), CFVR and FFR (figure 5).

(A) Energy of the early diastolic suction wave. Whereas adenosine-induced hyperaemia and coronary occlusion lead to a significant change of wave energy, no difference was found between proximal and distal segments at rest. * denotes statistically significant differences compared with proximal at rest (p<0.01 post hoc comparison). (B) Correlation between CFVR and the reserve of the early diastolic suction wave.
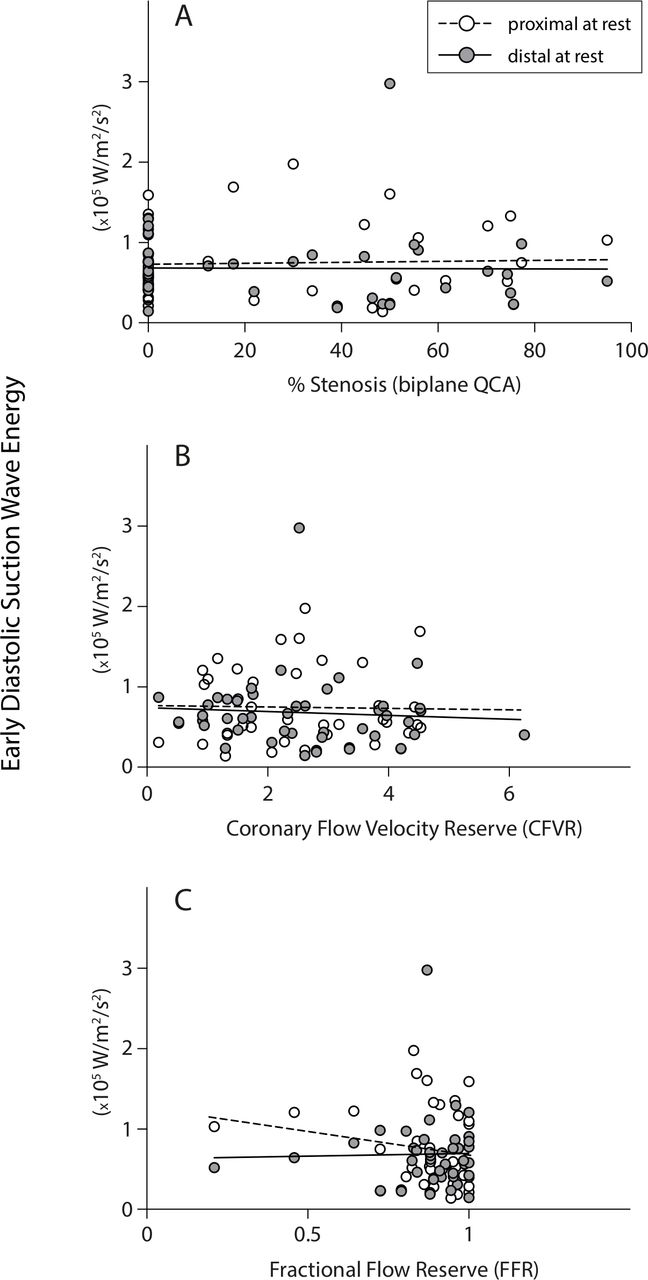
Lack of correlation between early diastolic suction wave energy and three parameters of stenosis severity, that is, per cent stenosis as assessed by biplane quantitative coronary angiography (QCA) (A), CFVR (B) and FFR (C).
Pulse wave entrapment distal to stenoses
Pulse wave entrapment phenomena could not be observed consistently in the distal segments in patients with coronary stenoses. We expected a reflection of the eaDSW with positive reflection coefficient, resulting in a forward-travelling decelerating wave immediately after the onset of the suction wave. These waves were either superimposed by the forward-travelling acceleration wave caused by aortic valve closure, or completely absent. Therefore, the (expected attenuating) effect of the collateral circulation on distal pulse wave entrapment could not be studied. Furthermore, no reduced eaDSW in patients with severe stenoses could be observed in proximal segments as an expression of reduced pulse transmission through the stenotic lesion.
Pulse waves during coronary occlusion
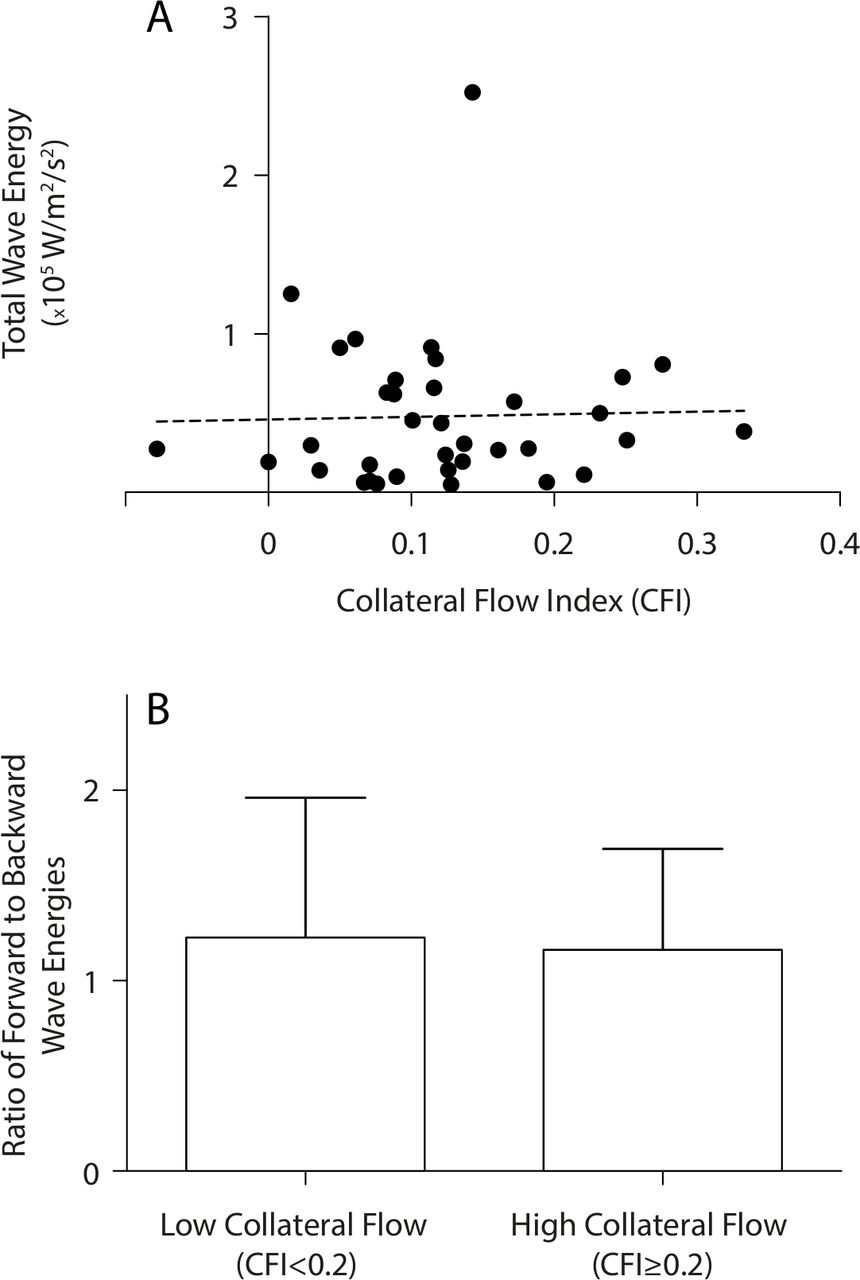
Coronary balloon occlusion leads to a significant decrease in total pulse wave energy in the distal segments. An eaDSW could not be identified systematically. The collateral circulation, as assessed by CFIv, did not correlate with total pulse wave energy. Furthermore, there was no difference in the dominant directionality of the pulse wave energy between patients with high compared with low collateral flow (figure 6).
Relations between CFI and pulse wave energies in the occluded coronary artery. Note the lack of correlation between CFI and total wave energy (A). The ratio between total forward-running and backward-running wave energies did not differ significantly between patient with low and high collateral flow (B).
Discussion
This study shows that microvascular dilation in the coronary circulation increases distal diastolic suction wave energy along with the increase of coronary flow velocity. There was, however, no detectable difference in early diastolic suction between proximal and distal segments, and between various stenosis severity degrees. Therefore, we cannot conclude that early diastolic suction offers an advantage over flow reserve measurements for the detection of stenosis severity, neither distally nor proximally. In the distal segments, overall pulse wave energy was strongly reduced in occluded coronaries, but no such trend could be detected for early diastolic suction in stenotic arteries. The compensatory predilation of the coronary microvasculature due to stenoses may, thus, account for the stable distal early diastolic suction. The current study cannot elucidate the exact behaviour of early diastolic suction in the range of severe coronary stenoses, because most investigated vessels were within a mild-to-moderate stenotic range. However, this constitutes the important range of stenoses that is most often investigated haemodynamically to guide percutaneous intervention in clinical routine.18
Theoretically, any pulse wave travelling from the coronary periphery towards the ostium, such as the eaDSW, should be reflected at the distal end of the coronary stenosis, leading to a forward-travelling decompression wave.19 Despite the detailed investigation into the individual waveform using WIA, we were not able to identify any such distal wave morphology systematically. We can, therefore, not confirm the presence of a distal pulse wave entrapment in stenosed coronary arteries in this study. The expected pulse wave temporally collides with another forward-travelling wave, that is, the compression wave arising from aortic closure. If superposition of two forward-travelling waves with opposing effect (compression vs decompression) occurs, no differentiation can be obtained by WIA. We observed that although the aortic closure signal was absent in some patients, indicating a possible annihilation by the reflection signal, it was not systematically converted into a decompression wave. Therefore, any potential reflection wave did not carry enough energy to overrule the aortic closure signal in our study population. As a consequence, we were also unable to assess the modifying effect of the collateral circulation on peripheral wave reflections. During coronary occlusion, the WIA signal amplitude was weak. Frequently, it was not possible to acquire a Doppler signal that could be distinguished unambiguously from vascular wall motion artefacts. These artefacts are particularly disturbing for WIA, because they introduce short velocity transients, thus creating brief but sharp excursions in the wave intensity signals. Even after removing non-periodic signal components by superposition over an acquisition period of 30 s, unacceptable high noise levels remained. Current intracoronary Doppler probes must, therefore, be considered incapable of measuring pulse waves in occluded coronary arteries.
Limitations
The main limitation of the current study is that only a limited number of severe stenoses were included. This hampers a more comprehensive observation of the eaDSW behaviour in the range where autoregulation is exhausted.
Intracoronary Doppler signal acquisition is difficult to obtain and prone to noise. Although SNR was acceptable during vessel patency, it still required time-consuming wire positioning and long acquisition sequences to improve signal reliability. In low-flow situations, such as during coronary occlusion, reliable wave intensity signals are particularly difficult to obtain.
Indirect evidence of distal pulse wave entrapment could have been achieved by measuring trans-stenotic pulse wave transmission instead of distal reflection. This would have circumvented the difficulties encountered in visual pattern recognition. However, an additional measurement at the proximal end of the stenosis (free from crosstalk arising from other coronary branches) would have been necessary.
Furthermore, intracoronary adenosine injections do not maximally dilate the coronary microvasculature when applied in non-toxic (non-AV blocking) doses. This contributes to the variability of the data.
There is no standard filtering procedure for pressure and flow velocity signals. Savitzky-Golay filters are widely used in WIA, but the amount of filtering is not standardised despite its obvious widening effect on wave intensity curves. Such standardisation efforts are currently being undertaken.20 We used only a minimal amount of filtering for high-frequency noise removal.
Finally, simultaneous left ventricular (LV) pressure measurements would allow distinguishing between LV relaxation from vasomotor effects on the eaDSW.12
Conclusion
Based on our observations and given the currently available measurement technique, we conclude that the assessment of the eaDSW and its reflections is not useful for the quantification of coronary stenosis severity or the collateral circulation in clinical practice.
References
Footnotes
Contributors *SFdM: planning, construction of measurement equipment, software writing, data acquisition, data analysis and manuscript preparation. CG, SG and TT: patient recruitment, data acquisition and data analysis. SC: patient recruitment and data acquisition. RV: planning, patient recruitment and data acquisition. KG: preliminary in vitro tests, construction of measurement equipment, software writing and data acquisition. *CS: planning, data acquisition, data analysis and manuscript preparation. The authors marked with * are responsible for the overall content as guarantors.
Funding This study was supported by a grant of the Swiss National Science Foundation (SNF 32003B_163256/1).
Competing interests None declared.
Patient consent for publication Not required.
Ethics approval The protocol was accepted by the Ethics Committee of the Kanton of Bern, Switzerland (KEK-#145/09).
Provenance and peer review Not commissioned; externally peer reviewed.
Data availability statement Data are available on reasonable request.