Article Text

Abstract
Objective The end-systolic pressure–dimension relationship (ESPDR) and the preload recruitable stroke work (PRSW) relationship are load-insensitive measures of contractility, but their clinical application has been limited by the need to record multiple beats over a wide volume range. In this study, we therefore sought to validate a new method to concomitantly determine the ESPDR and the PRSW relationship from a single beat.
Methods Pressure–dimension loops were recorded in 14 conscious dogs under various haemodynamic and pathological conditions. Multiple-beat PRSW relationship was determined for its slope (Mw) and for a dimension-axis intercept (Dw). The ESPDR represented by the formula  , was estimated from a steady-state, single-beat late-systolic pressure–dimension relationship. The single-beat Mw was determined as an end-systolic pressure when the end-systolic dimension was equal to Dw.
Results A strong correlation was observed between multiple-beat and single-beat ESPDRs (zero-stress dimension; r=0.98, p<0.0001). The single-beat estimation of Mw calculated using the wall thickness was strongly correlated with the actual Mw (r=0.93, p<0.0001) and was sensitive enough to detect the change in contractility by dobutamine infusion (p<0.001) and by tachycardia-induced heart failure (p<0.001). Similar results were obtained for Mw estimated without information on wall thickness.
Conclusions Mw can be interpreted as an end-systolic pressure when the end-systolic dimension is equal to Dw. By using the non-linear ESPDR, accurate single-beat estimation of the ESPDR and Mw is possible even without information on wall thickness. These results should enhance the applicability of pressure–volume framework to clinical medicine.
- HEART FAILURE
- CARDIAC FUNCTION
- CONTRACTILITY
This is an Open Access article distributed in accordance with the Creative Commons Attribution Non Commercial (CC BY-NC 4.0) license, which permits others to distribute, remix, adapt, build upon this work non-commercially, and license their derivative works on different terms, provided the original work is properly cited and the use is non-commercial. See: http://creativecommons.org/licenses/by-nc/4.0/
Statistics from Altmetric.com
Key questions
What is already known about this subject?
Previous studies have proposed methods for estimating end-systolic pressure–volume relationship (ESPVR) and preload recruitable stroke work (PRSW) relationship independently, and they both fell short in linking the two into a single pressure–volume framework.
What does this study add?
This study demonstrated for the first time the underlying physiology of ventricular mechanics that links ESPVR and PRSW relationship. Such underlying physiology enabled us to accurately estimate these two contractile indices from a single control beat under various haemodynamic conditions in conscious dogs.
How might this impact on clinical practice?
Our single-beat approach may enhance the clinical applicability of ESPVR and PRSW relationship.
Introduction
An accurate assessment of the intrinsic ventricular contractile state that is independent of the preload and the afterload deepens and broadens the understanding of the pathophysiology of cardiovascular diseases and thereby helps enable effective diagnoses and treatment.1 ,2 While many of the indices of ventricular contractility are limited by their significant load dependence, the end-systolic pressure–volume relationship (ESPVR) has evolved as a prominent solution to this problem.3–5 Its strengths are not confined to the characterisation of ventricular contractile properties but also lie in its ability to enable the assessment of ventricular energetics and predictions of pump performance through ventricular–vascular coupling in the pressure–volume (P–V) plane, which has been shown to be related to the clinical outcome in various types of heart failure.6–9 The preload recruitable stroke work (PRSW) relationship is defined as the relationship between ventricular stroke work and end-diastolic volume.10–12 It can often be derived from the same set of P–V data used for determining the ESPVR and provides an even less load-dependent measure of ventricular contractility. Unlike the ESPVR, the PRSW relationship is difficult to directly link with arterial loads in the P–V plane, but due to its strong linearity over a wide range of physiological loads and independence of chamber size and volume signal gain,11–13 the PRSW relationship compensates for potential limitations of the ESPVR. For instance, linear regression of the ESPVR often yields a non-physiological, negative volume-axis intercept and it shifts with inotropic interventions.14 ,15 Moreover, the heart-size dependency of the ESPVR limits comparisons between ventricles of different dimensions. Therefore, utilising both indices derived from the P–V data has provided a powerful tool for precisely assessing the cardiovascular dynamics.16
These attractive features of the P–V framework have prompted many to develop methods for single-beat estimation of these two indices to facilitate their clinical use since otherwise multiple variably loaded beats with simultaneous measurements of ventricular pressure and volume are required. However, the previously proposed methods only estimated the ESPVR or PRSW relationship independently,13 ,17–19 and they both fell short in linking the two into a single P–V framework. We sought to develop such a unified approach, and introduce and validate a novel method that concomitantly determines both the end-systolic pressure–dimension relationship (ESPDR) and the PRSW relationship from a single steady-state cardiac beat.
Methods
Preparation
P–V data were obtained from 14 mongrel dogs previously reported in other studies.20–23 All studies were performed at the Johns Hopkins University and protocols were approved by the Animal Care and Use Committee. Animals were chronically instrumented with a left ventricular cavity micromanometer (P22; Konigsberg Instruments) to measure the left ventricular pressure, and endocardial and epicardial sonomicrometers to determine the anteroposterior short-axis cavity dimensions and wall thickness. A pneumatic occluder also placed around the inferior vena cava allowed transient reduction of preload. Epicardial pacing leads were sutured to the left atrium and the right ventricular free wall and connected to a programmable stimulator (Spectrax; Medtronics). The chest was closed; catheters and leads were externalised and animals provided 10 days to fully recover before study.
Data acquisition and experimental protocols
Data were obtained from conscious animals resting quietly in an upright position within a sling apparatus. Five dogs (group I) were studied before and after acute haemodynamic changes from atrial pacing (160–170 bpm) or dobutamine 10 μg/kg/min infusion. Group II (n=5) had dilated heart failure induced by ventricular tachypacing at 210 bpm for 3 weeks. An analysis was obtained before and after inducing heart failure. Group III (n=4) was a model of hypertension induced by angiotensin II (10 ng/kg/min intravenous×2–4 days). Preangiotensin and postangiotensin II data were measured at sinus rhythm.
Data analysis
Pressure–dimension (P–D) data were digitised at 250 Hz. The short-axis outer dimension was defined as the chamber dimension plus ×2 wall thickness. The systolic function was indexed on the basis of the stroke dimension (SD), fractional shortening (SD/end-diastolic dimension (Ded)) and the peak rate of the left ventricular pressure rise (dP/dtmax). The regional stroke work (rSW) was calculated as the external work of the left ventricle, the integral of the transmural pressure with respect to the chamber dimension (ie, the P–D loop area) for each cardiac cycle. The regional PRSW relationship was determined by linear regression analysis of the rSW and Ded data obtained during transient vena caval occlusion, according to the equation 1where Mw and Dw are the slope and dimension-axis intercept, respectively.10
Outline of single-beat estimation for the ESPDR and PRSW relationship
A basic principle for estimating Mw is based on the new finding that physiologically links the PRSW relationship with the ESPDR as follows: rSW can be approximated as 2where Pes is the end-systolic pressure. Moreover, by definition
 3where Des is the end-systolic dimension. Combining equations (2) and (3) with equation (1) yields
 4By rearranging equation (4), we obtain
 5
5
Importantly, equation (5) indicates that when Des equals Dw, Pes should be equal to Mw. Therefore, 6where Pes(D) represents the ESPDR, a function of Pes according to the end-systolic chamber dimension. Therefore, the point (Dw, Mw) can be viewed on the P–D plane as a point on the ESPDR, and Mw can be defined as Pes when Des is equal to Dw (figure 1).
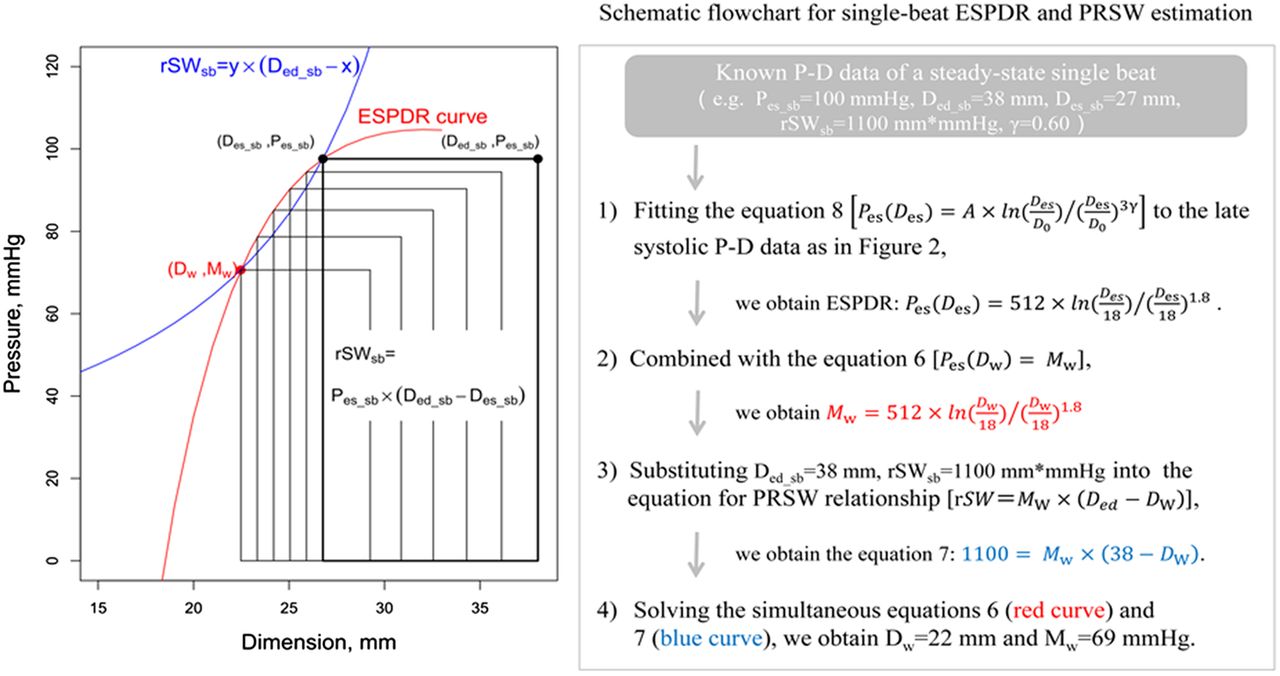
Outline of the single-beat estimation of the preload recruitable stroke work relationship. Mw and Dw represent the slope and dimension-axis intercept of the PRSW relationship, and the point (Dw, Mw) on the P–D plane is on the ESPDR curve represented by the red curve (equation (6) in the text). At the same time, by definition, Dw and Mw fulfil the following relationship: rSWsb=Mw×(Ded_sb—Dw), which is represented by the blue curve (equation (7) in the text). Therefore, once the ESPDR is determined, Dw and Mw can be calculated as the intersection of the red and blue curves. Ded_sb, end-diastolic dimensions of the baseline single beat; Des_sb, end-systolic dimensions of the baseline single beat; ESPDR, end-systolic pressure–dimension relation; Pes_sb, end-systolic pressure of the baseline single beat; P–D, pressure–dimension; PRSW, preload recruitable stroke work; rSWsb, regional stroke work of the baseline single beat.
Also from equation (1), 7where rSWsb and Ded_sb are rSW and Ded of the baseline single beat before caval occlusion, respectively.
The relationship between the ESPDR and the PRSW coefficients represented by equation (6) indicates that once ESPDR is determined, PRSW coefficients are also accurately obtained as the intersection of the two curves representing equations (6) and (7) (figure 1) by solving the two simultaneous equations. For this purpose, we used a non-linear rather than a linear ESPDR based on the concept of maximum systolic myocardial stiffness as previously proposed by Mirsky et al.14 We modified Mirsky's original formula for the ESPVR so that it represents the ESPDR as outlined in detail in Detailed Methods in the online supplementary material. As in equation (A6) in Detailed Methods, ESPDR can be expressed as a function of Des in a simple form: 8where A is an amplification factor and the exponent γ determines the curvilinearity of the ESPDR, which was obtained as a regression coefficient of curve fitting for plots of cavity dimension versus midwall dimension during an entire cardiac cycle before vena caval occlusion (see online supplementary figure S1).24
Supplemental material
To derive the PRSW relationship from a single beat, the ESPDR as defined in equation (8) must be determined from the same single beat. We hypothesised that the late-systolic P–D loop and the ESPDR curve follow similar regression curves. Thus, the single-beat ESPDR was estimated by fitting points between the peak systolic pressure and the end-systolic points on a steady-state single loop using a non-linear least-square method, as shown in figure 2A. The zero-stress dimension determined from the single-beat ESPDR was denoted as D0(SB). We utilised an iterative method to identify the end-systolic points (figure 2A). The ESPDR based on multiple P–D loops during vena caval occlusion was also determined with a non-linear least-square method of end-systolic points,25 along with the use of an iterative method (figure 2B). The zero-stress dimension obtained from multiple beats was denoted as D0(MB).

Multiple-beat and single-beat determination of the ESPDR. (A) The single-beat, ESPDR was estimated by fitting points between the peak systolic pressure and the end-systolic points on a steady-state single-loop (open red circles) against  (equation (8) in the main text) using a non-linear least-square method. While the selection of the end-systolic point influences the estimation of the ESPDR curve and the zero-stress dimension (D0), the zero-stress dimension defines the reference distension to calculate myocardial stiffness and, thus, determines the point that attains maximal stiffness (ie, the end-systolic point). We used an iterative method to determine a combination of the end-systolic point and the zero-stress dimension (D0(SB), which meets the above conditions. (B) Multiple-beat ESPDR (red curve). Points of maximal stress–strain ratio (open red circles) are determined and are fitted against the above equation using a non-linear least-square method, with the use of an iterative method to determine the zero-stress dimension, D0(MB). ESPDR, end-systolic pressure–dimension relationship.
Once the ESPDR was determined from a single control beat, the PRSW relationship was obtained by solving the simultaneous equations for the point of (Dw, Mw), as mentioned previously (figure 1). The PRSW coefficients obtained from the single-beat approach were denoted as Mw(SB) and Dw(SB).
While a P–D loop is often approximated by a square with the same area as in equation (2), a minor discrepancy exists between the actual Pes and the mean ejection pressure (=rSW/SD) and thus, between the actual and the rectangular-approximated ESPDR. A more detailed method to adjust these curves is shown in online supplementary figure S2.
More simplified method without information on instantaneous wall thickness
As described previously, the measurement of any instantaneous changes in wall thickness is required to determine γ in equation (8). However, as will be described later in the results, γ is fairly constant across different individuals and different haemodynamic statuses. Therefore, the single-beat estimation of the PRSW relationship may be possible using an assumed value for γ even without information on the wall thickness. The Dw and Mw values were estimated using measurements of the wall thickness and were denoted as Dw(SB) with WT and Mw(SB) with WT, respectively, while those estimated with the assumed γ were denoted as Dw(SB) without WT and Mw(SB) without WT.
Statistical analysis
Data were presented as mean±SD. The PRSW estimates were compared with the actual PRSW measurements (ie, Dw and Mw) using the Pearson correlation coefficient and linear regression analysis. A comparison of the variables obtained before and after the intervention was performed using paired t-test. Extraction of the conventional haemodynamic parameters from the P–D loops and the single-beat estimation based on the above algorithm was performed using custom analysis programmes. Statistical analyses were carried out with R V.3.0.1 and the package ‘nleqslv’ to solve systems of non-linear equations (Team RDC. R: A language and environment for statistical computing. Vienna, Austria: R Foundation for Statistical Computing, 2008).26
Results
Achieved changes in haemodynamic status
The different groups and interventions yielded multiple changes in cardiac function (table 1). Infusion of dobutamine increased heart rate, systolic pressure and contractility over baseline. As reported previously, Dw was quite constant within an individual with these acute haemodynamic changes. Chronic tachycardia pacing resulted in decreases in systolic pressure, dP/dtmax, fractional shortening and Mw. Hypertension from angiotensin II led raised systolic pressure and dP/dtmax but had no significant change in Mw. Collectively, these data provided an Mw range from 25 to 147 mm Hg.
Achieved change in haemodynamic status
Determination of the exponent of ESPDR, γ
The exponent of ESPDR, γ, which was obtained from data on chamber size and wall thickness, was 0.61±0.05 at baseline (table 2). The small SD suggested that γ was relatively constant among different individuals. The mean value of 0.61 at baseline was used as an assumed γ value for the estimation of Dw(SB) without WT and Mw(SB) without WT.
Regression coefficients of the end-systolic pressure–dimension relationship
Multiple-beat ESPDR and PRSW estimates
As summarised in table 2, the zero-stress dimension obtained from the multiple-beat ESPDR (D0(MB)) did not change significantly with atrial pacing and dobutamine administration; mean changes of <1 mm from the baseline support the validity of the non-linear ESPDR formulated as equation (8) to accurately predict the real ESPDR. D0(MB) increased significantly after chronic tachycardia pacing (p=0.01) but did not change significantly with the alteration in the afterload in the hypertension model.
To test the validity of the basic principle of our estimation method that the point (Dw, Mw) is on the ESPDR curve, PRSW coefficients that had been estimated using multiple-beat ESPDR were compared with the actual PRSW coefficients (ie, Mw and Dw). The actual and ESPDR-based multiple-beat PRSW coefficients were robustly correlated with each other (r=0.98, p<0.0001 for Dw and Mw estimation, figure 3). Importantly, a similar analysis using the linear ESPDR reduced the robustness (r=0.91 for Mw and r=0.73 for Dw), which highlights the importance of selecting an appropriate ESPDR model.
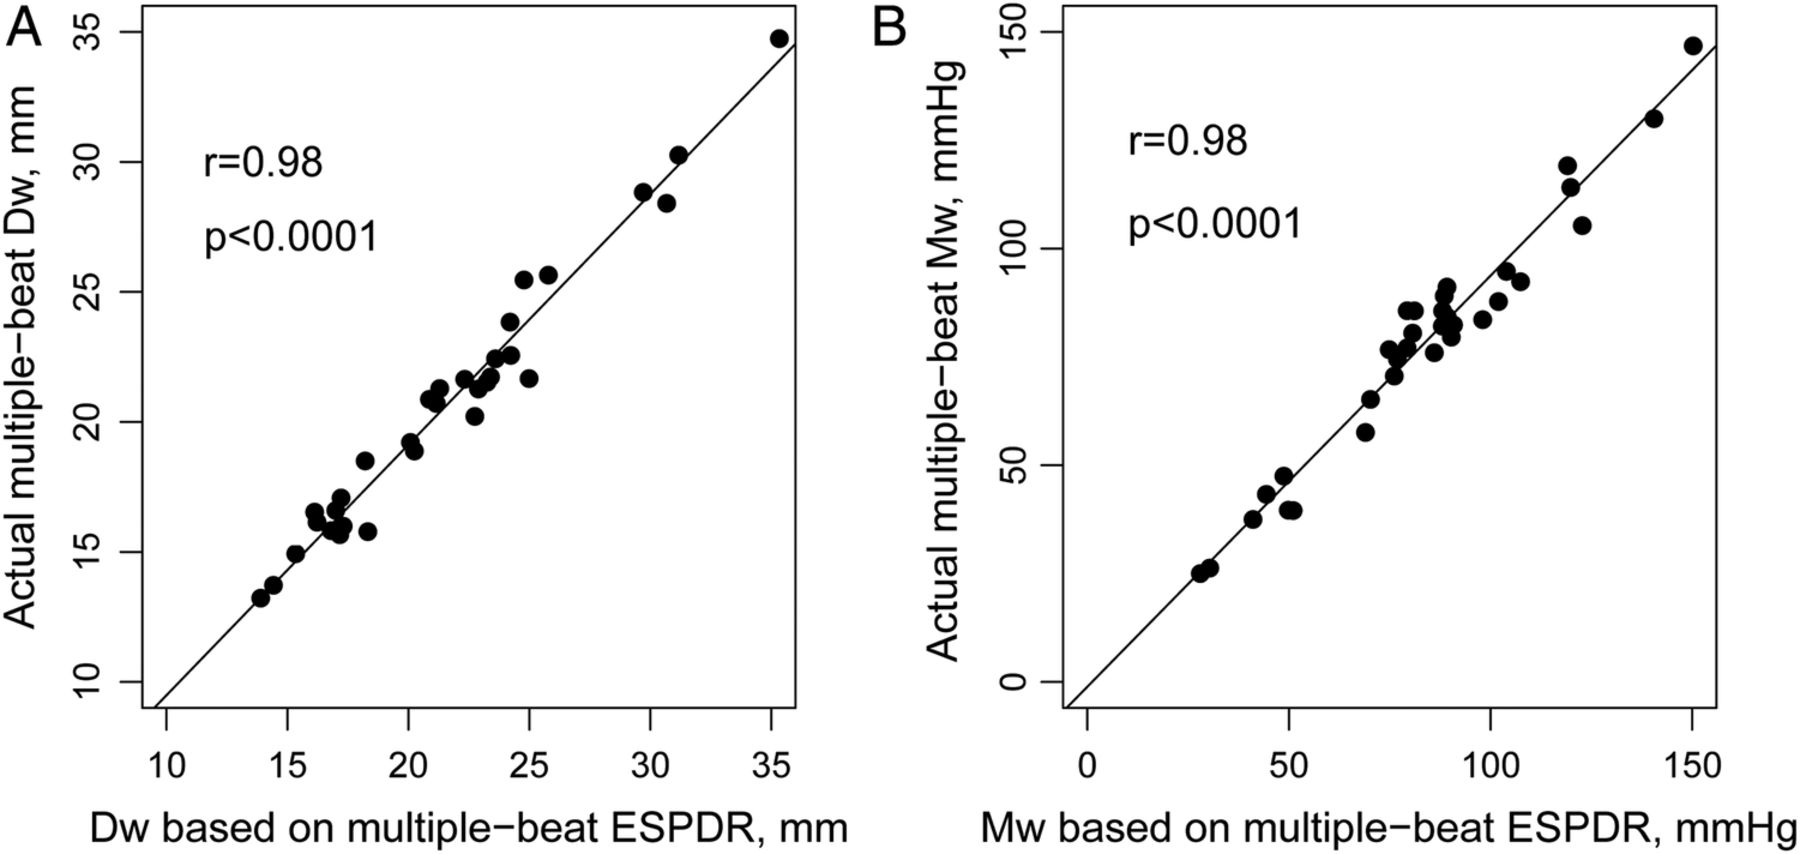
Actual and ESPDR-based multiple-beat PRSW relationship. Scatterplots comparing the estimated PRSW coefficients based on the multiple-beat, ESPDR to the actual PRSW analysis (Dw and Mw). These graphs validate the basic principle of the estimation method that the point (Dw, Mw) is on the rectangular-approximated ESPDR curve. Dw and Mw, dimension-axis intercept and slope of preload recruitable stroke work relationship, respectively; ESPDR, end-systolic pressure–dimension relationship; PRSW, preload recruitable stroke work.
Single-beat estimation of ESPDR and PRSW relationship
The iterative algorithm yielded an average of 14 points (range 4–54 points) on a steady-state P–D loop to be used for single-beat ESPDR estimation. As shown in figure 4A, a strong correlation was observed between D0(MB) and D0(SB) (r=0.98, p<0.0001). Moreover, the single-beat estimation of the PRSW slope that was calculated using the measured γ, Mw(SB) with WT, was strongly correlated with the actual PRSW slope, Mw (figure 4B, r=0.93, p<0.0001). The single-beat estimation using the wall thickness was sensitive enough to detect a change in contractility caused by dobutamine infusion (72±22 mm Hg at baseline vs 123±17 mm Hg on dobutamine, p<0.001) and by tachycardia-induced heart failure (79±10 mm Hg at baseline vs 33±9.1 mm Hg with heart failure, p<0.001).

Measured and estimated ESPDR/PRSW coefficients. Scatterplots comparing (A) the single-beat estimated zero-stress dimension (D0(SB)) and amplitude (A(SB)) of the ESPDR to multiple-beat ESPDR coefficients (D0(MB) and A(MB)); (B) the single-beat estimated PRSW dimension-axis intercept and slope using the measured γ (Dw(SB) with WT and Mw(SB) with WT) to similar measurements obtained from actual multiple-beat PRSW analysis (Dw and Mw); (C) the single-beat estimated PRSW dimension-axis intercept and slope using the assumed γ (Dw(SB) without WT and Mw(SB) without WT) to similar measurements obtained from the actual multiple-beat PRSW analysis (Dw and Mw). Dw and Mw, dimension-axis intercept and slope of preload recruitable stroke work relationship, respectively; ESPDR, end-systolic pressure–dimension relationship; PRSW, preload recruitable stroke work.
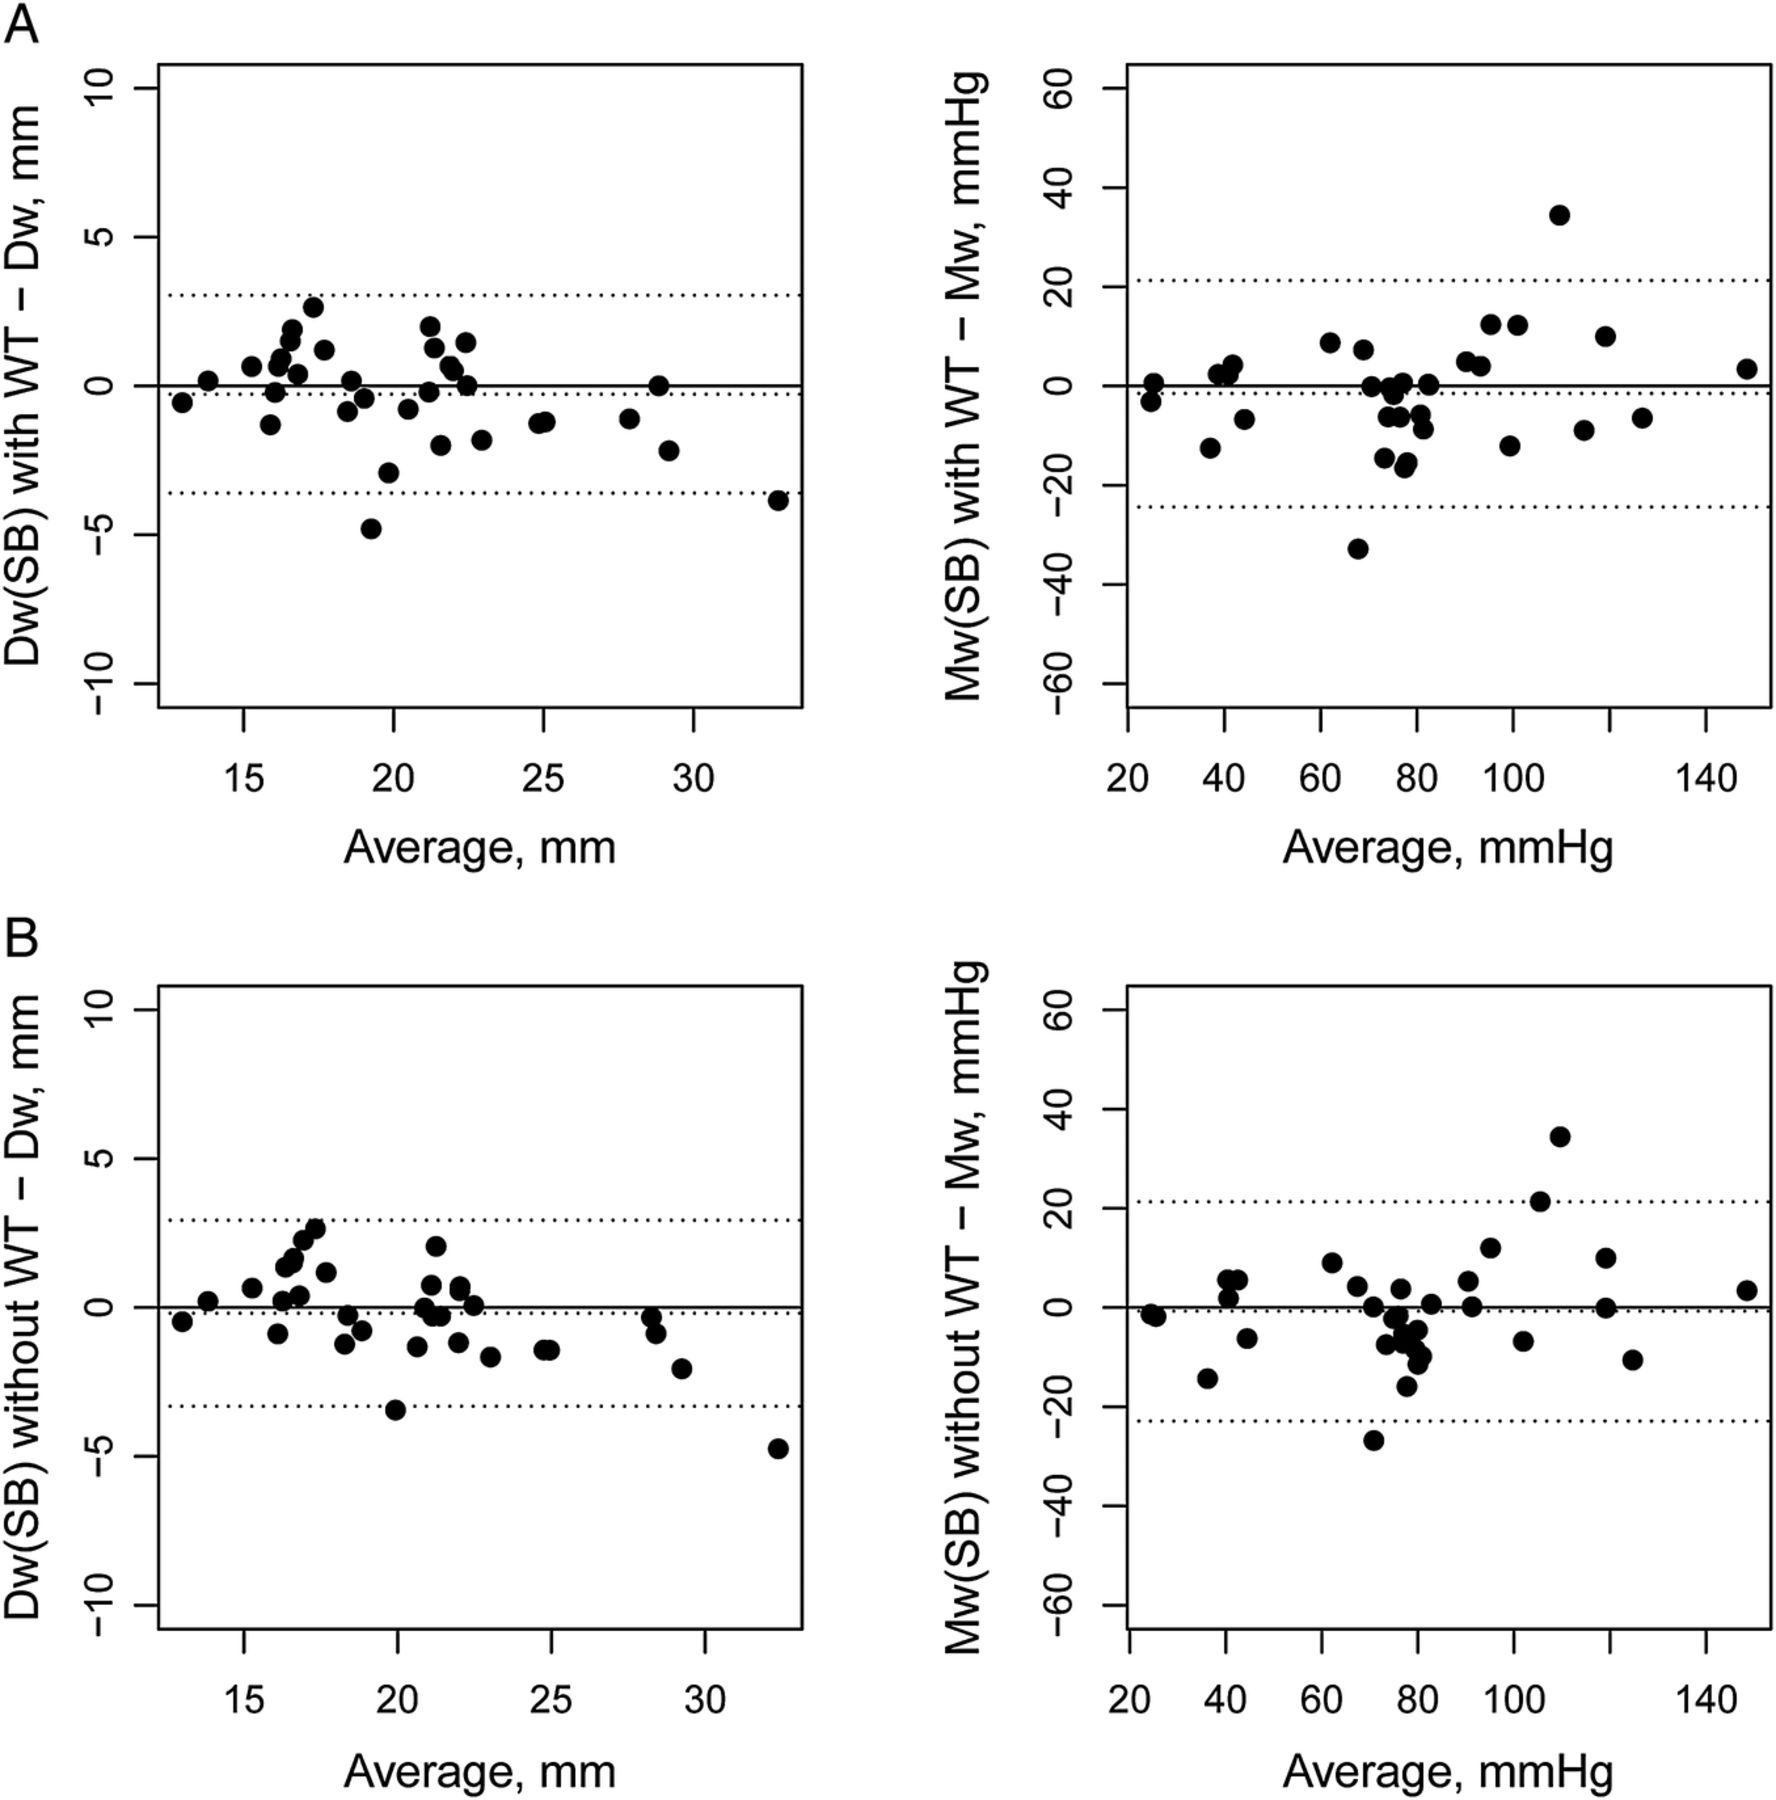
Similar results were obtained even using the assumed γ (γ=0.61). The PRSW slope estimates without wall thickness, Mw(SB) without WT, was strongly correlated with the actual Mw (figure 4C, r=0.93, p<0.0001), suggesting that an accurate estimation of the PRSW slope is possible even without information on wall thickness. The Mw(SB) without WT was able to detect the change in contractility induced by the dobutamine infusion (74±21 mm Hg at baseline vs 126±14 mm Hg on dobutamine, p=0.001) and by tachycardia-induced heart failure (76±9.0 mm Hg at baseline vs 32±8.8 mm Hg with heart failure). Bland-Altman plots showed no systematic underestimation or overestimation (figure 5).
Bland-Altman plots for the PRSW estimates. (A) Bland-Altman plots for the single-beat estimated PRSW dimension-axis intercept and slope based on the measurement of the wall thickness ((Dw(SB) with WT and Mw(SB) with WT). The dotted line represents the 95% limits for agreement. (B) Similar plots for the single-beat, estimated PRSW dimension-axis intercept and slope based on assumed γ (Dw(SB) without WT and Mw(SB) without WT). Dw and Mw, dimension-axis intercept and slope of preload recruitable stroke work relationship, respectively; PRSW, preload recruitable stroke work.
Further validation of single-beat estimation of ESPDR and PRSW relationship
The preload sensitivity of the estimation method was tested by applying it to each P–D loop during the inferior vena caval occlusion. Changes in estimates (D0(SB) and Mw(SB) with WT) according to a reduction in rSW are shown in online supplementary figure S3. Even when a P–D loop during preload reduction (20% reduction in rSW) was used for single-beat estimation, strong correlations were observed between multiple-beat and single-beat ESPDRs as well as for the PRSW slope (r=0.97 between D0(MB) and D0(SB) and r=0.91 between Mw(MB) and Mw(SB) with WT).
Discussion
This study provided several important findings: (1) the PRSW slope, Mw, can be interpreted as an end-systolic pressure when the end-systolic dimension is equal to Dw; (2) the non-linear ESPDR based on the concept of ‘maximum systolic myocardial stiffness’ enables the determination of the load-insensitive systolic zero-stress dimension and (3) the steady-state late-systolic P–D loop is closely related to the ESPDR curve, which allows for the single-beat estimation of the ESPDR. On the basis of these findings, we developed a novel approach to accurately estimate the ESPDR and PRSW relationship from a single control beat in various haemodynamic conditions in conscious dogs. These results should greatly enhance the applicability of the P–V framework, which has many strengths in characterising ventricular mechanics and performance.
Both the ESPVR and the PRSW relationship have been used as useful indices of a ventricular contractile property that is relatively insensitive to loading conditions. Somewhat surprisingly, the underlying physiology of ventricular mechanics that links these two indices has been lacking despite the fact that they are derived from the same set of P–V data. This study demonstrated for the first time that the point (Dw, Mw) is on the ESPDR curve and that the PRSW slope (Mw) can be interpreted as an end-systolic pressure when the end-systolic dimension is equal to the load-insensitive dimension, Dw. A great advantage of this finding is that the PRSW relationship can be estimated from the ESPDR. Moreover, if the ESPDR can be derived from a single beat, it can also provide a way to estimate the PRSW relationship from the same data. Numerous attempts have been made to extract information on multiple-beat ESPVR from a single-beat P–V loop, but all of them assumed a linear ESPVR.17 ,18 This is reasonable for practical purposes because the linear ESPVR provides a single number as the contractile index, end-systolic or as maximum elastance. However, for the particular purpose of an accurate estimation of the PRSW relationship, where the precise extrapolation of the ESPVR is of pivotal importance, a non-linear ESPVR model should be more appropriate than a linear model, as clearly shown by the reduced accuracy of the PRSW estimation with a linear ESPDR model. We adopted the concept of maximal myocardial systolic stiffness to derive a non-linear ESPDR, which was originally proposed by Mirsky et al.14 In their studies in dogs and humans, they demonstrated that the model provided a more reliable trajectory of the ESPVR and the zero-stressed volume than a linear ESPVR.14 ,27 The validity of this model as formulated in equation (8) was also supported by several pieces of evidence in this study. First, similar to the report from Mirsky et al,14 we confirmed based on this formula that the systolic zero-stress dimension was insensitive to acute haemodynamic change (table 2). Second, the excellent agreement between the actual PRSW coefficients and those estimated based on multiple-beat ESPDR (figure 3) provides direct evidence that a curvilinear model more accurately predicts the actual changes in end-systolic pressure with changes in end-systolic dimension, compared with a linear model. In addition, the model predicts the reported physiology of the enhanced curvilinearity of ESPVR with increased contractility15 because equation (8) indicates that higher contractility (Mw) within an individual (ie, fixed D0 and Dw) is reflected by an increase in the amplitude factor (A in equation (8)) and thus should result in an apparently more curvilinear ESPDR as an effect of the amplification. Moreover, the exponent γ, a true regulator of curvilinearity in our model, is determined by the ventricular mass/volume ratio alone. This relationship also predicts that those with a substantially increased ventricular mass, such as with hypertrophic cardiomyopathy, would have less curvilinear ESPDR due to low γ, which is consistent with the steep and more linear ESPVR reported in humans with a hypertrophic left ventricle.28
With this model, we developed a new method for ESPDR determination from a single control beat. The method relied on the fact that the late systolic P–D loop and the ESPDR curve follow similar regression curves (figure 2). The similarity of the two curves occurs because the points on both curves attain a similar myocardial stiffness at various ventricular dimensions. By definition, the ESPDR is a set of points attaining the maximal stiffness equal to the baseline end-systolic point, while late systolic points achieve a myocardial stiffness similar to the end-systolic point. This trend was clearly demonstrated in online supplementary figure S4, which has a small plateau at late systole; thus, the maximal myocardial stiffness is almost achieved during late systole. Consistent with this notion, the late-systolic stress–volume relationship has been reported to reflect contractility.29 ,30
Karunanithi et al13 previously reported a single-beat estimation method for PRSW relationship in conscious dogs assuming that the ratio of the volume-axis intercept of PRSW relationship (Vw) to the baseline end-diastolic volume is constant. However, their method is vulnerable to acute volume load (increase in end-diastolic volume) by definition and the aforementioned ratio was not quite constant in human data.19 Moreover, the greatest advantage of the P–V framework can be extracted when one focuses on the entire P–V data set rather than a single number, end-systolic elastance or Mw, as an index of contractility.16 The single-beat approach proposed in this study provides the entire ESPDR that accurately reflects a real ESPDR. This approach is presented with a control P–D loop and also with information for another contractile index of the PRSW relationship; therefore, the advantage of the P–V framework obtained from multiple variably loaded P–V data can be used from a single control beat. Thus, our method is clearly advantageous over the previously proposed methods for the single-beat estimation of the ESPVR or PRSW relationship, which primarily rely on the single number of the end-systolic elastance, or Mw.13 ,17–19
Further considerations and study limitations
There are several issues that need to be discussed to further enhance applicability and practicability of our new method. This study validated the new single-beat approach using P–D rather than P–V relationships. This point is in a sense an advantage of this study because previous studies reported that P–D relations corresponded well with the P–V data not only in normal hearts but also in failing hearts21 and because measuring the dimension is much easier than measuring the volume. In addition, our methods have the potential for non-invasive applications by using echocardiographic measurements of ventricular dimensions and tonometric measurements of arterial pressure, which warrant further investigations.31 Nonetheless, in cases with apparent regional left ventricular dysfunction, in which one-dimensional information does not represent the ventricular volume and mass, volume data should be used. However, the key theories for the present method, represented by equations (6) and (8), are not confined to the use of dimension but rather also permit the use of volume. Thus, it is highly likely that our methodology can be applied to the P–V data, which needs to be confirmed in future studies.
While our single-beat ESPDR estimation seems robust in the lower dimension range, especially below the baseline end-systolic dimension, the estimated ESPDR may not be exactly in the higher dimension range, as shown in figure 2. However, this issue is unlikely to affect the prediction accuracy of D0 and Mw, as both D0 and Dw are below the baseline end-systolic dimension for physiological status.
Lastly, while γ seems to be relatively constant in the general population, in those with extreme hypertrophy of the ventricle, measurement of wall thickness would be necessary for our single-beat approach, as the estimation without information on wall thickness relies on the uniformity of γ across different individuals.
Conclusions
The proposed method of single-beat estimation of the ESPDR and the PRSW relationship should greatly enhance the utility of the P–D framework in animal (dog) studies. Further studies are warranted to test whether a single-beat P–V framework would provide the same information as the multiple-beat method in humans.
References
Footnotes
Contributors RI and HS were involved in conception and design. HS was involved in acquisition of data. RI, DAK and HS were involved in analysis and interpretation of data. RI and HS were involved in drafting of the manuscript. DAK was involved in critical revision of the manuscript for important intellectual content.
Funding This study was supported by the Fukuda Foundation for Medical Technology.
Competing interests None declared.
Provenance and peer review Not commissioned; internally peer reviewed.
Data sharing statement No additional data are available.