Article Text

Abstract
Objective To characterise the trends in the left ventricular assist device (LVAD) implantation rates and outcomes between 2004 and 2011 in the Medicare population. Since the approval of the HeartMate II in 2008, the use of LVADs has steadily climbed. Given the increase in LVAD use, issues around discharge disposition, post-implant hospitalisations and costs require further understanding.
Methods We examined LVAD implantation rates and short-term and long-term outcomes among Medicare fee-for-service beneficiaries hospitalised for LVAD implantation. We also conducted analyses among survivors 1-year post-discharge to examine rehospitalisation rates. Lastly, we reported Centers for Medicare & Medicaid Services (CMS) payments for both index hospitalisation and rehospitalisations 1 year post-discharge.
Results A total of 2152 LVAD implantations were performed with numbers increasing from 107 in 2004 to 612 in 2011. The 30-day mortality rate decreased from 52% to 9%, and 1-year mortality rate decreased from 69% to 31%. We observed no change in overall length of stay, but post-procedure length of stay increased. We also found an increase in home discharge dispositions from 26% to 53%. Between 2004 and 2010, the rehospitalisation rate increased and the number of hospital days decreased. The adjusted CMS payment for the index hospitalisation increased from $188 789 to $225 697 over time but decreased for rehospitalisation from $60 647 to $53 630.
Conclusions LVAD implantations increased over time. We found decreasing 30-day and 1-year mortality rates and increasing home discharge disposition. The proportion of patients rehospitalised among 1-year survivors remained high with increasing index hospitalisation cost, but decreasing post-implantation costs over time.
- HEART FAILURE
This is an Open Access article distributed in accordance with the Creative Commons Attribution Non Commercial (CC BY-NC 3.0) license, which permits others to distribute, remix, adapt, build upon this work non-commercially, and license their derivative works on different terms, provided the original work is properly cited and the use is non-commercial. See: http://creativecommons.org/licenses/by-nc/3.0/
Statistics from Altmetric.com
Key messages
-
What is already known about this subject?
-
LVADs are a life-saving therapy whose use is increasing over time.
-
What does this study add?
-
Most patients are alive one year after LVAD placement with increasing costs for the procedure. Although many patients are discharged to home, rehospitalisation rates remain high.
-
How might this impact on clinical practice?
-
These trends in mortality, rehospitalisation and cost of LVAD implantation merit consideration by patients, physicians, and policy makers.
Introduction
Over the last decade, since the publication of the Randomised Evaluation of Mechanical Assistance in the Treatment of Congestive Heart Failure (REMATCH) trial in 2001,1 left ventricular assist devices (LVADs) have become an established life-saving therapeutic option in the treatment of elderly patients with end-stage heart failure, who are often ineligible for heart transplant. After the release of the REMATCH trial results, in 2002 the USA Food and Drug Administration (FDA) approved the use of LVADs as destination therapy.2 This was followed by the decision from the Centers for Medicare & Medicaid Services (CMS) to pay for LVADs as destination therapy.3 Further, in 2005 the American College of Cardiology/American Heart Association guidelines expanded the use of LVADs to include ‘highly selected patients with refractory end-stage heart failure with estimated survival of <50% at one year’(Level of Evidence: B).4 However, large device size, high cost and device-related complications limited the use of LVADs at that time.5–7 Despite these challenges, Hernandez et al8 reported that LVAD implantation rates were increasing among Medicare beneficiaries from 2000 to 2006.
A new generation of much smaller devices with less morbidity came with the FDA approval of the HeartMate II in 2008, which demonstrated 1-year survival rates up to 85%.9–11 Khazanie et al12 described a continued increase in LVAD implantations after 2006 and reported stable cost of LVADs over time. Given the increase in LVAD use, issues around discharge disposition, post-implant hospitalisations and costs require further understanding. Accordingly, we used data from all Medicare fee-for-service beneficiaries 65 years or older to determine the current trends in device utilisation, short-term outcomes, long-term outcomes, discharge disposition and costs for LVADs.
Methods
Data sources and coding
In the USA, CMS is an agency within the US Department of Health & Human Services responsible for administration of several key federal healthcare programmes including Medicare. Medicare is the federal health insurance for patients older than 65 years, or patients with disabilities or end-stage renal disease. Medicare fee-for-service is a programme that provides hospital insurance (Part A) and supplementary medical insurance (Part B) to eligible residents.13 In this study, we used inpatient National Claims History files from CMS to identify all Medicare fee-for-service beneficiaries who were hospitalised for LVAD placement between 1 January 2004 and 31 December 2011. The administrative claims included information on patient demographics (age, sex and race), admission, procedure, discharge dates, discharge disposition, discharge diagnosis and procedure codes (as coded by the International Classification of Diseases, Ninth Revision, Clinical Modification (ICD-9-CM)). We defined LVAD implantations as hospital discharges that included the ICD-9-CM procedure code for LVAD implantation (37.66). To isolate LVADs placed for long-term therapy, we excluded codes 37.62, 37.65 and 37.68 used for temporary non-implantable, or external or percutaneous external assist devices. We obtained corresponding Medicare denominator files from 2004 to 2011, which contained information on patients’ eligibility and enrolment in Medicare, and mortality information, including both in-hospital and non-hospital deaths. We used the 2003 file as a baseline file to determine beneficiaries’ length of fee-for-service status in 2004. We included all beneficiaries aged 65 years and older who resided in the USA. For 1-year outcomes, the 2011 data were used as a follow-up for 2010 and the analyses were restricted from 2004 to 2010.
Patient characteristics and comorbidities
We reported patient characteristics yearly over the study period. We examined the clinical characteristics of patients admitted for LVAD implantation across years and stratified by age (65–74 and 75 years or older), sex, and race (white, black and other). We determined race from the Medicare denominator file, which used patient-reported data from the Social Security Administration.14 We identified comorbidities from secondary diagnosis codes of the index hospitalisation for LVAD surgery and principal or secondary diagnosis codes of hospitalisations up to 1 year before the index hospitalisation. This method and corresponding diagnosis codes have been used for profiling hospitals by the CMS 30-day mortality measures for acute myocardial infarction,15 heart failure15 and pneumonia.16 We used the 2003 data as a baseline file to determine patients’ comorbidities in 2004.
LVAD implantation rates and mortality
For each year, we calculated the LVAD implantation rate by dividing the number of LVAD implantation procedures performed (numerator) by the total accumulated person-years of Medicare fee-for-service beneficiaries for that year (denominator). We calculated person-years for each beneficiary to account for new enrolment, disenrolment or death during an index year. To calculate in-hospital, 30-day, and 1-year mortality, we identified all LVAD implantations that occurred in a given year. If a patient had more than one LVAD implantation in a given year, an implantation was randomly selected. The procedure date for the LVAD surgery represented the ‘time zero’ for the mortality analysis. We conducted sensitivity analyses comparing age-sex-race mortality models with age-sex-race-comorbidity models to assess the potential influence of changing comorbidity coding patterns on trends in risk-adjusted mortality.
Length of stay, discharge disposition and 30-day readmission rates for index hospitalisation
We calculated hospital length of stay (LOS) as the difference between the discharge and admission dates. We defined pre-LOS as the date from admission to the date of LVAD implantation minus 1 and post-LOS as the date from the day of the procedure to the date of discharge.
We defined 30-day readmission as all-cause readmission to an acute-care hospital within 30 days of discharge from the index LVAD surgery. This strategy is consistent with that used for CMS publicly reported measures.17–19 Major discharge dispositions included discharge to home; to home with in-home healthcare, and to a skilled nursing facility or intermediate care facility.
Rehospitalisations among 1-year survivors
Using the patient identifier, we calculated the number of patients surviving 1 year after LVAD implantation who were rehospitalised within 1 year. Rehospitalisation rate was defined as the total number of all-cause rehospitalisations to an acute-care facility within 1 year from the discharge of the index hospitalisation divided by the total number of 1-year survivors. Rehospitalisation duration was defined as the mean number of days spent in the hospital per patient within 1 year.
CMS payments
The CMS payment for the index hospitalisation was defined as the total payment made from CMS for the LVAD implantation hospitalisation. The CMS payment for rehospitalisations was defined as the total payment made per living LVAD patient for all rehospitalisations within 1 year after the index discharge. We adjusted all dollar amounts for the index stay to 2011 values by applying the CMS Market Basket update for the inpatient hospital prospective payment system (operating only). We adjusted all dollar amounts for the rehospitalisation analysis to 2010 dollars using the same inflation factor.
Statistical analysis
We reported LVAD implantation rates per 1 million person-years. We expressed mortality, readmission and major discharge disposition as percentages. We expressed LOS as mean (SD) days. We used the Mantel-Haenszel χ2 test to analyse whether changes over time in the outcomes were statistically significant.
To estimate the annual change in LVAD implantation over time, we fitted a linear mixed effects model with a Poisson link function and state-specific random intercepts, and adjusted for demographics (age, sex and race). Risk-adjustment models were developed for a broader population of hospitalised Medicare patients with heart failure rather than this specific cohort who received LVADs.15 For this analysis, we modelled time by using 2004 as a reference and including seven indicator variables for the subsequent years in the model. The estimate of the indicator variables represents the risk-adjusted change in LVAD implantation rates in the index year, compared with 2004. To estimate the national trends of in-hospital, 30-day and 1-year mortality, we fitted a linear mixed effects model with a logit link function and hospital-specific random intercepts, adjusting for patient covariates from previously validated mortality models including age, sex, race, 14 comorbidities available from administrative coding and a continuous time variable, ranging from 0 to 7, representing 2004 to 2011 (2010 for 1-year mortality). For 30-day all-cause readmission rates, we constructed a Cox proportional model with hospital-specific random intercepts and the time variable, adjusting for patient demographics and comorbidities. A 95% CI was also calculated for each point estimate from the models. A p value of <0.05 (two-sided test) was considered statistically significant. All analyses were conducted using SAS V.9.3, 64-bit Windows version (SAS Institute Inc, Cary, North Carolina, USA).
We obtained Institutional Review Board approval through the Yale University Human Investigation Committee, which waived the requirement for informed consent. Confidential data were protected through a data use agreement with CMS.
Results
Patient characteristics and LVAD implantations
The final sample consisted of 236 624 284 observations in the denominator files, representing 33 952 331 unique individual Medicare fee-for-service beneficiaries who contributed to 225 292 512 person-years of observation from 2004 to 2011. The mean age of patients undergoing LVAD was stable at 71 years (p=0.3 for trend). Several comorbidities were more commonly coded in LVAD recipients over time, including renal failure (17.8–54.2%, p<0.001), respiratory failure (8.4–23.5%, p<0.0056) and malnutrition (3.7–26.3%, p<0.001) (table 1).
Characteristics of patients undergoing LVAD implantation, 2004–2011
There were 2152 LVAD implantations performed during the 8-year period, and the number of implantations increased from 107 (3.7/1 million person-years) in 2004 to 612 (21.9/1 million person-years) in 2011, a relative increase of 491.0% (figure 1). Through 2009, only 108 (9.0%) of the LVAD recipients included in our cohort received heart transplantation within 1 year after LVAD placement. Over time, LVAD implantation increased more among patients aged 65–74 years than among patients ≥75 years, although a substantial increase was also seen in this latter group with 103 patients over 75 years who received an LVAD in 2011 compared to 19 patients in 2004. In all years, men received more LVADs than women. In 2011, 517 (42.4/1 million person-years) and 95 (6.0/1 million person-years) LVADs were implanted in men and women, respectively (table 2). Moreover, LVAD implantations increased the most among black patients (704.0%) compared to whites over time.
LVAD implantation rates among Medicare fee-for-service beneficiaries, 2004–2011
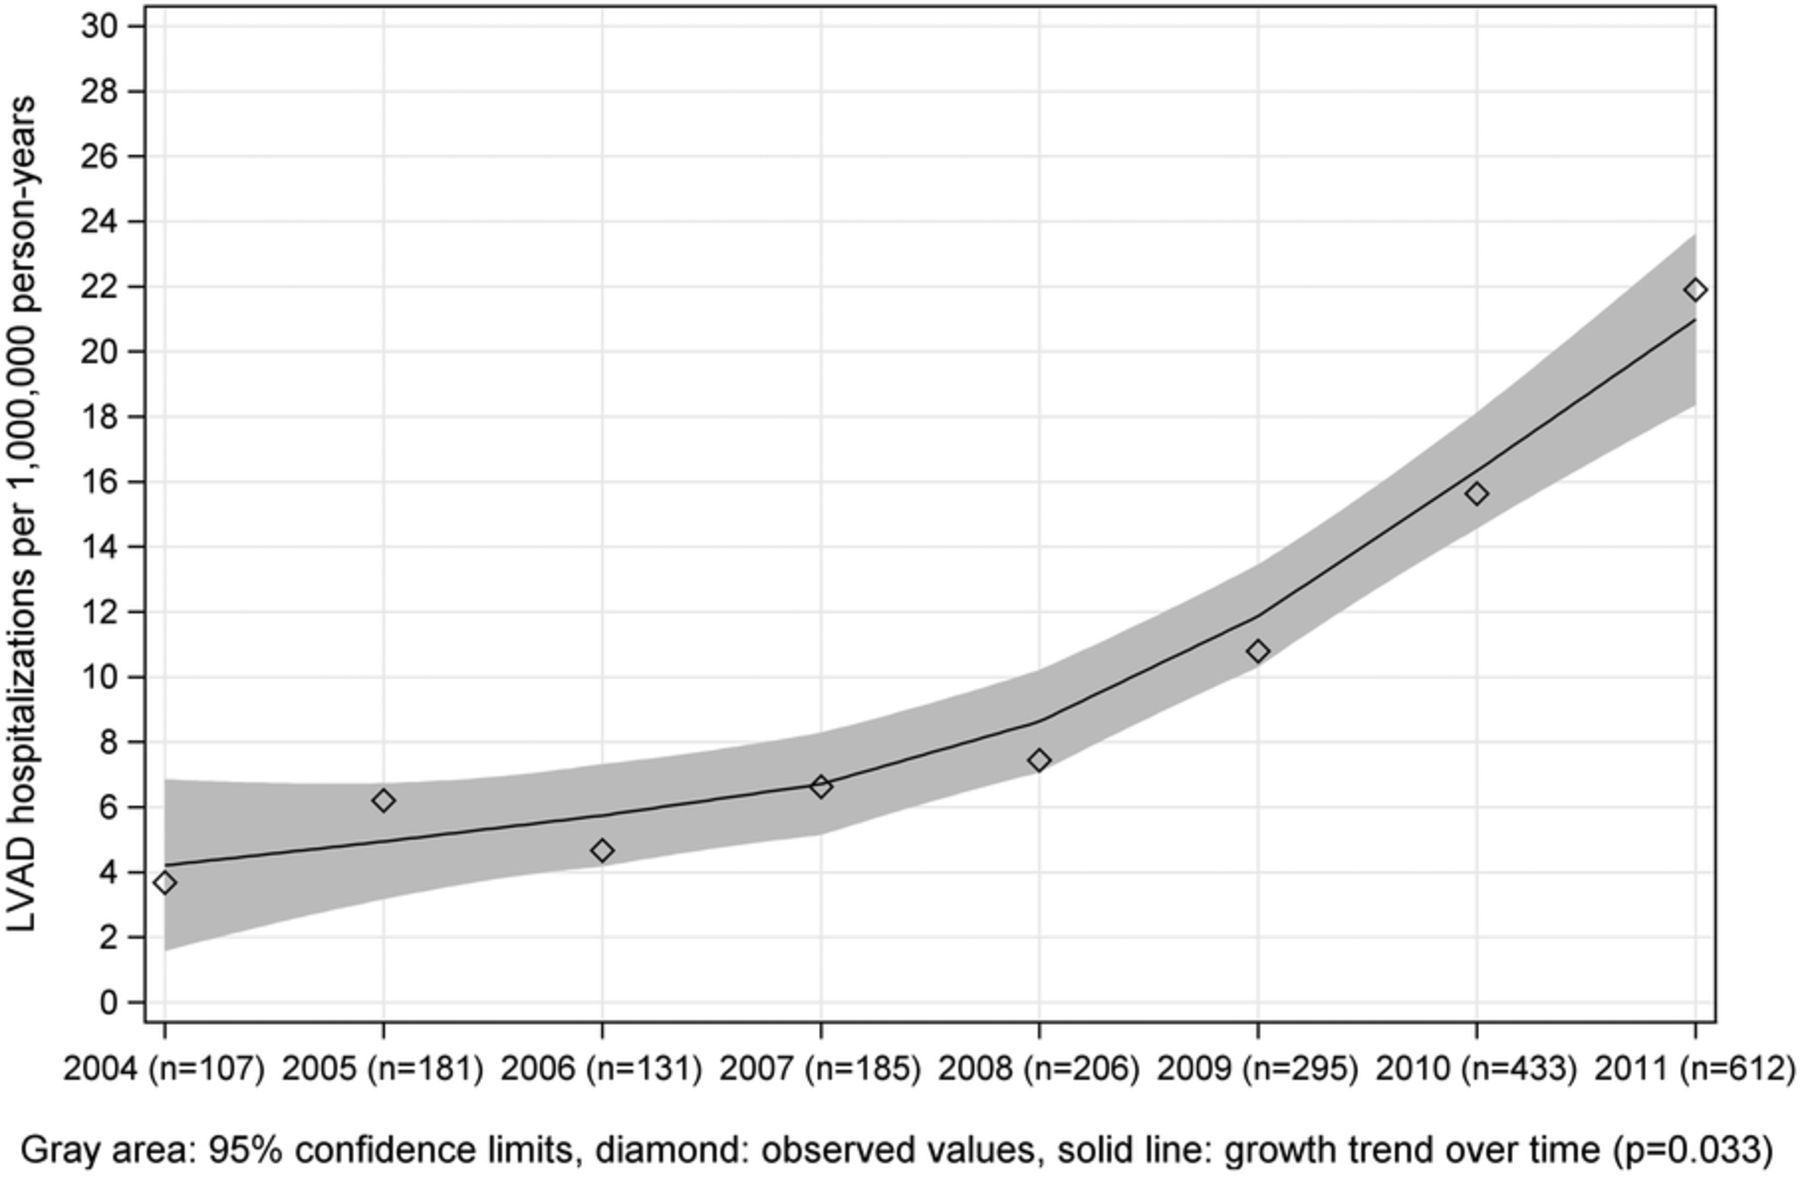
Trends in LVAD implantation rates among the Medicare population from 2004 to 2011. Rates of LVAD implantation were calculated as numbers of LVAD procedures per 1 million person-years. Grey area: 95% confidence limits; diamond: observed values; solid line: growth trend over time; p=0.0395. LVAD, left ventricular assist device.
Changes in mortality and readmission rates among LVAD recipients
There were substantial declines in in-hospital (57.9–6.0%), 30-day (52.3–9.0%) from 2004 to 2011 and in 1-year mortality rates (69.2–31.2%) from 2004 to 2010, all p values <0.01 for linear trends, despite fluctuations throughout the study period. In the subgroup analysis, we found the steepest declines in unadjusted in-hospital mortality rates among women (69.2–21.1%) and whites (56.3–15.7%). Declines in 30-day mortality rates were also seen across all subgroups with the most dramatic declines among the following: patients aged ≥75 years (69.2–3.3%), women (61.5–12.6%) and non-whites, non-blacks (80.0–17.2%). The steepest declines in unadjusted 1-year mortality rates were noted in a similar profile of subgroups (table 3). After adjusting for demographics and comorbidities, the annual change in in-hospital, 30-day and 1-year mortality rates remained statistically significant (OR=0.73, 95% CI 0.69 to 0.78; OR=0.75, 95% CI 0.71 to 0.79; OR=0.86, 95% CI 0.79 to 0.94, respectively; figure 2).
Outcomes among patients undergoing LVAD in Medicare fee-for-service, 2004–2011

(A) Observed relative and risk-adjusted annual changes for mortality rates and 30-day readmission rates comparing 2011 with 2004. (B) Point estimates with respect to changes of hospitalisation rates, 30-day, and 1-year mortality, comparing 2004 to 2011.
There was a 22.0% relative decrease in the unadjusted 30-day readmission rate (38.1–29.7%) over time. Additional changes were noted in the subgroup analysis by race, with black patients presenting the most dramatic decrease (51.3% relative decrease) in readmission over time. After risk-adjustment, the overall 30-day readmission rate was not statistically significant (relative risk=0.97, 95% CI 0.91 to 1.03) (figure 2).
Length of stay and discharge disposition
No significant changes were noted for the overall LOS (23.6 days in 2004–27.3 days in 2011). Pre-LOS changed from 11.4 to 8.7 days and with mean post-LOS rising from 12.2 to 18.6 days, a relative increase of 52.4% (table 3).
The percentage of patients discharged home without home care increased from 12.1% to 18.0% over time; while the percentage of patients discharged with home care increased from 14.0% in 2004 to 34.8% in 2011 (table 3). The number of patients discharged to home or to home with home care showed a relative increase of 48.7% and 148.5%, respectively.
Rehospitalisation-related outcomes
The number of patients alive 1 year after LVAD implantation increased from 45 (42.0%) in 2004 to 348 (80.0%) in 2010 whereas the proportion of survivors that were rehospitalised within 1 year increased from 70.0% to 80.0% (p<0.01). The mean number of rehospitalisations per patient showed a 28.0% relative increase from 2004 compared to 2010. The five most frequent reasons for rehospitalisations were complications related to the procedure (31.9%) followed by heart failure (23.0%), cardiac dysrhythmias (14.7%), gastrointestinal haemorrhage (14.7%) and other disorders of the intestine (12.1%). Among patients rehospitalised the overall mean days spent in hospital per patient decreased from 30.2 days in 2004 to 20.8 days in 2010 (p<0.01).
CMS payments
The total CMS payment for the index hospitalisation per patient increased from $188 789 to $225 697 whereas the payment for all rehospitalisations in the first year after implantation decreased from $60 647 to $53 630, from 2004 to 2010. The average annual change for index hospitalisations was 2.8% from 2004 to 2011 and for rehospitalisations was 4.6% from 2004 to 2010. For the index hospitalisation and rehospitalisations, CMS payments were calculated using the average annual change, a method that takes into account the fluctuations during the study period.
Discussion
In this analysis we found an LVAD implantation rate increase of nearly 491% with a sharp rise since 2008, coincident with the approval of the Heart Mate II device by the USA Food and Drug Administration.2 Between 2010 and 2011 our results show 433 and 612 LVAD implants consistent with the 5th Interagency Registry for Mechanically Assisted Circulatory Support (INTERMACS) report, which is not restricted to older patients. They report 537 LVADs implanted as destination therapy in 2010 and 723 implantations in 2011. Khazanie et al,12 in another observational study, published similar LVAD rates and higher transplantation rates among Medicare beneficiaries likely due to a more restrictive definition of our LVAD cohort.12 Although we cannot definitively state LVADs were implanted as destination therapy in our study, we limited our cohort to patients with heart failure for more than 1 year who received an LVAD. This cohort restriction was made in order to capture the closest estimate of long-term LVADs implanted. Only 108 patients in our cohort received heart transplant mostly because a great part of our population is older than the maximum recommended age of 70 years for heart transplantation.20 ,21 This is much smaller than the 6th INTERMACS report in which 37% of LVAD patients receive heart transplant, suggesting again that LVADs in our cohort were placed as destination therapy.22
The short-term and long-term mortality outcomes of patients who received an LVAD improved significantly. In 2011, we noted a survival rate of 70% at 1-year, which is consistent with the reported survival of the 5th INTERMACS report as well as the findings of Khazanie et al,12 and much improved from the 1-year survival in 2004 of 30%. 23 This observation has several possible explanations. First, the refinements in LVAD technology resulted in smaller devices that facilitate less invasive procedures and may have produced fewer postoperative complications, less need for replacement and more successful recovery. Second, clinicians may have gained experience not only with surgical techniques, but also with optimising patient selection for LVAD procedures. This may be quite relevant given the observed 56% relative decline in mortality rates among patients older than 75 years, which suggests that other factors, such as the comorbidities or clinical status, may play a more important role in outcomes among elderly patients than age.
To better characterise aspects of the hospitalisations related to LVAD implantations, we separated overall LOS into pre-LOS and post-LOS. Our overall LOS of 27 days is shorter than that reported by Khazanie et al who found an average LOS of greater than 1 month. We found a decreased pre-LOS and an increased post-LOS when comparing to our own data, which is counter to their findings. It is unclear why our estimates differed. One explanation could be the difference in our two cohorts. As mentioned above, we attempted to restrict our cohort to non-emergent implants whereas Khazanie et al included patients with codes for more acute conditions such as cardiogenic shock. Our pre-LOS fluctuated, which precluded us from making inferences about the slight overall increase. Post-LOS, however, consistently increased. Given the lack of literature on post-procedure quality of care or LOS, we can only speculate that post-procedure time may have been used to optimise postoperative care and care coordination post-discharge, possibly affecting mortality rates such as the 30-day mortality rate. Longer post-LOS may contribute to our observation of an increase in the number of patients who were discharged to home and a decrease in the number who were discharged to skilled nursing facilities.
In order to assess patients’ inpatient needs 1 year after LVAD implantation we calculated rehospitalisation rates, which may reflect morbidity, as well as the total number of days in the hospital, which may reflect quality of life. Our results show that approximately 80% of patients are rehospitalised within 1 year of implant. We found that this estimate was stable over time and consistent with prior observational study.12 We also found that patients spend an average of 20 days per year at the hospital. Currently, the time spent in a hospital setting is approximately 30% less than in 2004. Despite the steady high-rehospitalisation rates, the duration of total hospital stay decreased over time suggesting improvements in quality of life, consistent with a study that demonstrates improvements in exercise performance and heart failure severity post-LVADs.24
New expensive technologies such as LVADs raise concerns regarding resource allocation, with cost being a potential limitation for its broader use.25 Although, we found that index LVAD hospitalisation remains expensive over time, payments for rehospitalisations within the first year post-discharge declined despite increasing rates of device implantation in older and sicker patients. We speculate that our findings of decreasing costs of readmissions may be due to a number of reasons including less severe clinical reasons for rehospitalisation, decreased number of days patients spend at the hospital and improvements in outpatient follow-up. These findings underscore the importance of LVADs as a treatment option despite the initial costs to the health system and reinforce the need to improve rehospitalisation rates among the elderly.
Our findings should be interpreted in light of several limitations. The study is a descriptive report, including only Medicare fee-for-service beneficiaries, limiting our ability to generalise our results to patients younger than 65 years or outside of Medicare. However, approximately 80% of heart failure patients are older than 65 years with limited therapeutic options in end-stage heart failure,26 making the elderly an important group in which to examine issues related to the use of LVADs. In addition, we cannot comment on trends in patients enrolled in Medicare managed care programmes. As more patients have migrated into Medicare managed care programmes over time,27 related changes in the fee-for-service population may have affected the observed trends. Our data cannot distinguish between bridge to transplant and destination therapy, as we used ICD-9-CM codes to define our cohort. Moreover, using claims data, we cannot identify the model of device implanted. Specification of LVAD models placed is beyond the scope of this study; however, during the study period only HeartMate VE, HeartMate XVE and HeartMate II were approved in the USA.2 ,3 ,5 ,28 Additionally, the use of Medicare claims data restricted our ability to include some operation-specific information in our risk-adjustment model. Finally, we determined the presence of comorbidities based on administrative claims data rather than clinical confirmation; however, administrative codes have been shown to be highly specific for cardiovascular diagnosis and risk factors.29
The rate of LVAD implantation in the USA increased substantially from 2004 to 2011 among Medicare beneficiaries. More than 50% of the patients were discharged to home after device placement and 80% were alive 1 year later. Costs are still increasing for the index hospitalisation but appear to be decreasing for rehospitalisations. Despite the improvement in outcomes the absolute proportion of older patients with end-stage heart failure who receive this technology remains low.
References
Footnotes
-
Contributors JFL and HMK were involved in study concept and design. HMK took part in acquisition of data. JFL, NK, YW, MMD and HMK were involved in analysis and interpretation of data. JFL, NK and HMK took part in drafting of the manuscript. JFL, NK, YW, MMD, JASB-F, JAD, DLD, AAM and HMK were involved in critical revision of the manuscript for important intellectual content. YW took part in statistical analysis. HMK obtained funding for the study and also took part in administrative, technical or material support of the study. NK and HMK supervised the study.
-
Funding This study was supported by grant 1U01HL105270-05 (Center for Cardiovascular Outcomes Research at Yale University) from the National Heart, Lung and Blood Institute in Bethesda, Maryland.
-
Previous Presentation: These data were presented, in part, at the Quality of Care and Outcomes Research in Cardiovascular Disease and Stroke Conference of the American Heart Association, 9–12 May 2012, in Atlanta, Georgia and were presented, in part, at the Quality of Care and Outcomes Research in Cardiovascular Disease and Stroke Conference of the American Heart Association, 15–17 May 2013, in Baltimore, Maryland.
-
Competing interests HMK reports that he is the recipient of research grants from Medtronic and from Johnson & Johnson, through Yale University, to develop methods of clinical trial data sharing and is chair of a cardiac scientific advisory board for UnitedHealth.
-
Ethics approval We obtained Institutional Review Board approval through the Yale University Human Investigation Committee, which waived the requirement for informed consent. Confidential data were protected through a data use agreement with CMS.
-
Provenance and peer review Not commissioned; externally peer reviewed.
-
Data sharing statement No additional data are available.